This blog post contains a few demos for generating hash partitioned exchange spills. It does not attempt to explain why performance is so bad in some cases, but I think that the behavior here is simply interesting to observe. Note that all of the demos were done on SQL Server 2016 SP1 CU4. Some of this may not be reproducible on other versions.
Order Preserving Streams
First I need to say a few words about repartition and gather streams operators. Here’s an example of one:
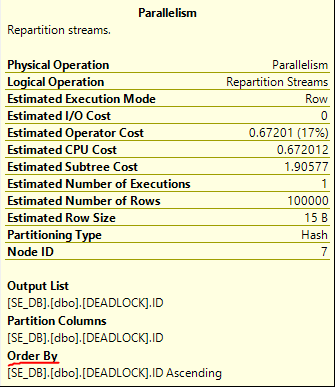
These operators are easy to misunderstand. Even when they have an “order by” they do not directly do a sort in the traditional sense. Instead, they rely on the ordered input threads to produce 1 or more ordered output threads. There’s no memory grant associated with them. For an illustration of how this could work, consider a very simple example with 4 rows on two threads:
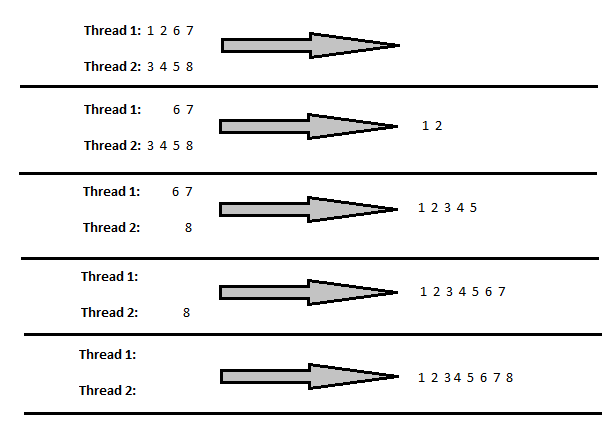
After the first step, values 1 and 2 from thread 1 are processed. There is a switch to thread 2 that moves 3, 4, and 5, and so on. This all explained in a much better way by Paul White in his talk on parallelism at the 2013 PASS Summit:
What is an Exchange Spill?
As usual, the good stuff is hidden in extended event descriptions:
Occurs when the memory communication buffers for a query with multiple Parallelism operators become full, resulting in one of the operators writing to TempDB. If this happens multiple times in a single query plan the query performance is impacted. Use this event in conjunction with any of the *_showplan events to determine which operation in the generated plan is causing the exchange spill using the node_id field
According to Paul White, one way to get a deadlock is when the buffers are full but there aren’t any rows on one of the threads. There is a brilliant demo that involves partitioning by round robin near the end of the talk that starts here:
This blog post focuses on deadlocks that occur with hash partitioning.
The Test Query
Only one table is needed to see exchange spills caused by hash partitioning. The first column stores the ID used for the join and the second column is used to pad out the pages. The clustered index isn’t a primary key to allow for duplicate values. Table definition:
DROP TABLE IF EXISTS DEADLOCK;

CREATE TABLE DEADLOCK (
	ID BIGINT NOT NULL,
	FLUFF VARCHAR(100)
);

CREATE CLUSTERED INDEX CI__DEADLOCK ON DEADLOCK (ID);
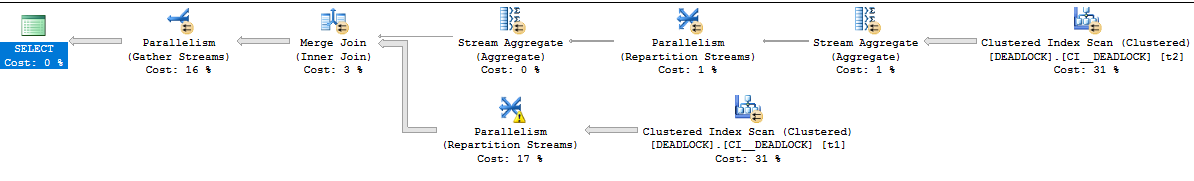
The query that I’ll run forces a parallel merge join with varying MAXDOP:
SELECT t1.ID
FROM DEADLOCK t1
WHERE EXISTS (
       SELECT 1
       FROM DEADLOCK t2
       WHERE t1.ID = t2.ID
)
ORDER BY t1.ID
OPTION (QUERYTRACEON 8649, MERGE JOIN, MAXDOP 2);
With this query, we can force an order preserving repartition streams to be hashed against a column with as few distinct values as we like. Note that there is an element of chance to this. For some data distributions a deadlock may not always occur. The performance of the same query can vary to an extreme degree as well.
Getting a Deadlock
One way to see a deadlock is by putting 50k rows into the table with four distinct values for ID:
TRUNCATE TABLE DEADLOCK;

INSERT INTO DEADLOCK WITH (TABLOCK)
SELECT
  (RN - 1) / 12500
, REPLICATE('Z', 100)
FROM (
       SELECT TOP (50000) ROW_NUMBER()
		OVER (ORDER BY (SELECT NULL)) RN
       FROM master..spt_values t1
       CROSS JOIN master..spt_values t2
	   CROSS JOIN master..spt_values t3
) t
OPTION (MAXDOP 1);

UPDATE STATISTICS DEADLOCK CI__DEADLOCK WITH FULLSCAN;
Running the SELECT query from before with MAXDOP 2 seems to pretty reliably produce a deadlock. The query typically takes around 7 seconds to run at first but it usually finishes much quicker after the deadlock checker has woken up. The deadlock can be seen with the exchange_spill extended event or by the tempdb spill in the repartition streams operator:
Putting the Dead in Deadlock
Some queries have extremely variable performance. They can run for seconds, minutes, hours, or even longer than a day. They can eventually be killed by the deadlock monitor. I had one such query running for longer than 24 hours, but apparently Microsoft got embarrassed and killed SSMS:

There are many ways to see this behavior. Inserting alternating 0s and 1s seems to do the trick:
TRUNCATE TABLE DEADLOCK;

INSERT INTO DEADLOCK WITH (TABLOCK)
SELECT
  RN % 2
, REPLICATE('Z', 100)
FROM (
       SELECT TOP (100000) ROW_NUMBER()
		OVER (ORDER BY (SELECT NULL)) RN
       FROM master..spt_values t1
       CROSS JOIN master..spt_values t2
	   CROSS JOIN master..spt_values t3
) t
OPTION (MAXDOP 1);

UPDATE STATISTICS DEADLOCK CI__DEADLOCK WITH FULLSCAN;
The first 49000 rows or so are displayed fairly consistently in SSMS. After that the query slows to a crawl. It only used 140 ms of CPU time after five minutes of execution. I wasn’t able to get this query to finish on my machine, but other similar queries finished after many hours. The data in sys.dm_exec_query_profiles is interesting:
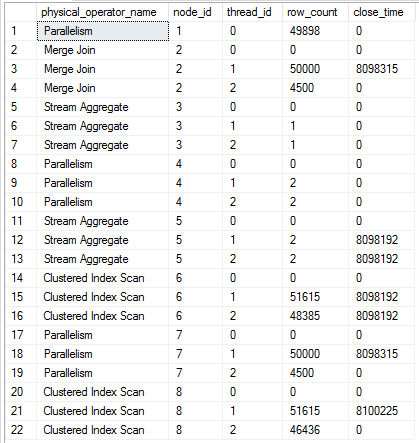
Assuming a packet size of 4500 rows, the scan at node id 8 is just one packet away from finishing. Thread 1 for the repartition streams is finished along with thread 1 of the merge join. All 50k rows with a value of 0 have been processed by the merge join but only 49898 rows made it to the gather streams at the end of the plan. I’ve seen this kind of behavior with the performance issue that affects some parallel queries with a TOP operator.
All six rows from sys.dm_os_waiting_tasks have a wait type of CXPACKET. There are resource descriptions of WaitType=e_waitPortClose. Ultimately, it’s not clear to me why this query appears to run “forever”, but one way or another it should eventually finish.
Final Thoughts
The same behavior can be seen in 2017 RC2. I couldn’t get either of the two example queries to finish on that version. Some of my test cases don’t cause deadlocks in 2016 SP1 CU2. It appears that Microsoft has done work in this area with negative consequences for some data distributions. A theory for why this happens can be found here. Microsoft appears to have fixed this in 2016 SP1 CU6.
Thanks for reading!
Going Further
If this is the kind of SQL Server stuff you love learning about, you’ll love my training. I’m offering a 75% discount to my blog readers if you click from here. I’m also available for consulting if you just don’t have time for that and need to solve performance problems quickly.