This blog post explores the scalability of the
Test Query
Start by putting 11 million rows into a heap. I don’t think that the value for the ID column particularly matters.
DROP TABLE IF EXISTS HB_DEMO;

CREATE TABLE HB_DEMO (ID VARCHAR(10));

INSERT INTO HB_DEMO WITH (TABLOCK)
SELECT TOP (11000000) '0'
FROM master..spt_values t1
CROSS JOIN master..spt_values t2
CROSS JOIN master..spt_values t3
OPTION (MAXDOP 1);
The test query that I’ll be running is the following:
SELECT MAX(HASHBYTES('SHA2_256', R1.ID))
FROM HB_DEMO R1
OPTION (MAXDOP 1);
The purpose of the MAX aggregate is to limit the size of the result set. This is a cheap aggregate because it can be implemented as a stream aggregate. The operator can simply keep the maximum value that it’s found so far, compare the next value to the max, and update the maximum value when necessary. On my test server, the query takes about 20 seconds. If I run the query without the HASHBYTES call it takes about 3 seconds. That matches intuitively what I would expect. Reading 11 million rows from a small table out of the buffer pool should be less expensive than calculating 11 million hashes.
From my naive point of view, I would expect this query to scale well as the number of concurrent queries increases. It doesn’t seem like there should be contention over any shared resources, so as long as every query gets on its own scheduler I wouldn’t expect a large degradation in overall run time as the number of queries increases.
A Trillion Spins
Putting that theory to the test, I kicked off 96 concurrent queries using SQLCMD. The server has 96 CPUs and I verified that each session went to its own scheduler. The overall run time was about 8 minutes instead of the expected 20 seconds. That’s a 24X performance degradation at scale. Both resource monitor and SQL Server claim that CPU is used at a very high rate. There are effectively no latch waits. The only notable wait is 4684777 ms of MEMORY_ALLOCATION_EXT, which seems like a lot, but it only works out to 10% of the workload time because I’m running 96 concurrent queries. As is, I can only account for 15% of the workload time through waits and expected CPU utilization of the queries. However, spinlocks have quite a story to tell:
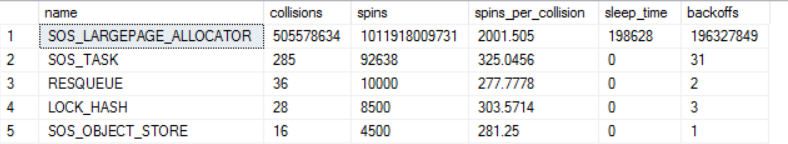
That’s a trillion spins on SOS_LARGEPAGE_ALLOCATOR in about eight minutes. It’s very hard to say that a specific number of spins, backoffs, or anything else related to spinlocks is “bad”. I view this as a sign of a potential problem because I can’t account for the workload time in any other way, the number of spins is so far ahead of second place, and I’ve run a lot of extreme workloads on this server and have never seen spins or backoffs approach levels like this in such a short period of time.
You may be wondering due to the LARGEPAGE part of the name if I have trace flag 834 enabled. I do not. SQL Server can use large pages for some internal structures even without TF 834. It just can’t use them for the buffer pool. This only works when LPIM is enabled, so a natural troubleshooting step is to disable LPIM.
A More Conventional Approach
With the conventional memory mode, the SOS_LARGEPAGE_ALLOCATOR spinlock disappears. This might seem like a good thing, but the workload still has the same scalability problems as before. The overall run still takes about eight minutes. MEMORY_ALLOCATION_EXT is by far the most prevalent wait:
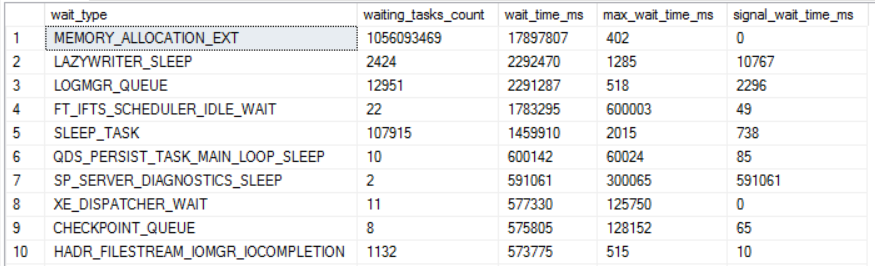
However, wait times only account for about a third of overall workload time. This does seem like an important clue, but I’m unable to source the full workload time to anything visible within SQL Server.
Sometimes SQL Server Doesn’t Tell the Whole Truth
This feels like a good use case for ETW tracing in windows. Resource monitor suggests that SQL Server is using a lot of CPU time, but I don’t know how to account for that CPU time within SQL Server. PerfView can be used to analyze call stacks and to see how much CPU time is spent on different parts of the code. This blog post isn’t a tutorial on how to use PerfView with SQL Server. I’m very inexperienced with the program and can barely manage to get results. This might be because I refused to watch the tutorial video.
I wanted the first test to be a baseline. I gathered data over a handful of seconds while running just a single query in SQL Server. To be clear, this testing was done with the conventional memory manager. Here is a screenshot of the CPU stacks:
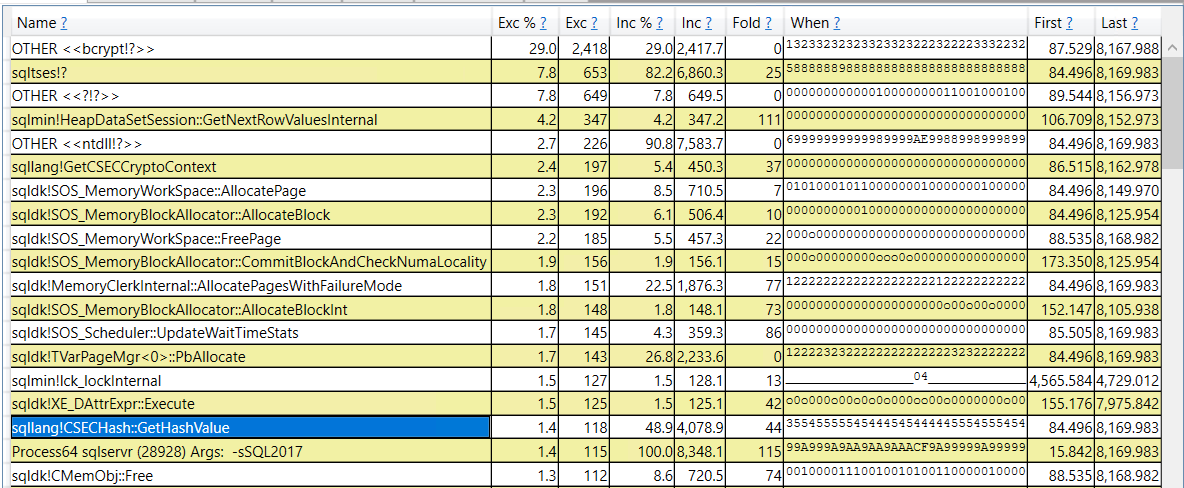
If I’m interpreting the data correctly, 29% of CPU time was spent on bcrypt (I assume this is a windows assembly that HASHBYTES calls) and 49% of the time was spent in some way getting the hash value. That’s lower than I expected based on earlier testing results, but I am tracing a 96 core server and some of those other 95 cores will be doing things even if I’m not running user queries on them.
The second test was with 96 concurrent queries. I again gathered data over a handful of seconds, but didn’t take care to sample the exact same number of seconds. Here is a screenshot of the CPU stacks for the 96 query test:
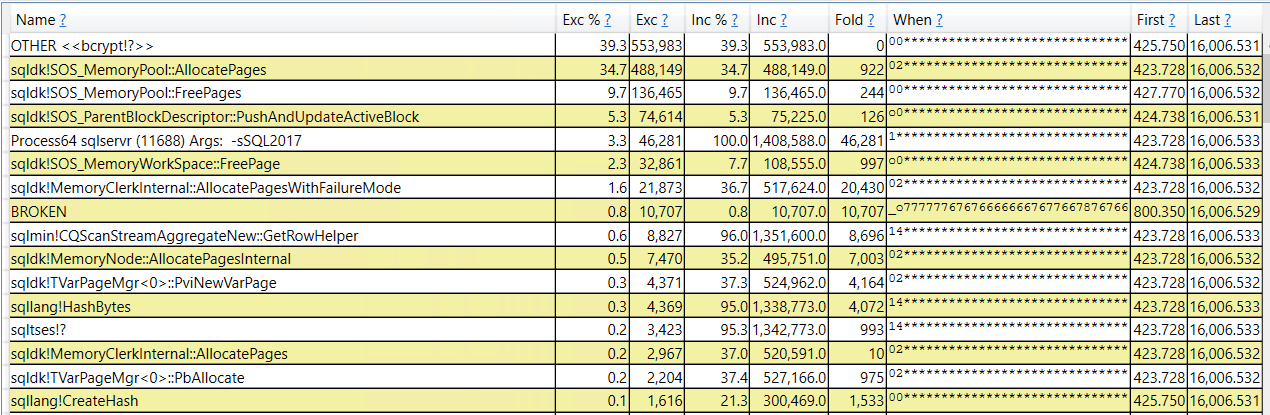
95% of the work done the server involves the HASHBYTES calls. That makes sense, but within those calls there’s a large amount of time spent allocating and deallocating pages. That wasn’t expected, especially because none of my queries even ask for a memory grant. However, I can finally account for the unexpected CPU time. Perhaps the MEMORY_ALLOCATION_EXT wait event is more important than I realized. It may be useful to try to look at page allocations within SQL Server.
Unreasonable Extended Events
The only way I know to track page allocations is through extended events. There’s an extended event called page_allocated with the following description: “Occurs when memory page is allocated”. I can’t imagine ever enabling this on a production server, but I’m on a development server and I don’t care about overhead. I created the event session with a scary sounding name, turned it on, ran a single query on an 11 million row table, and turned it off. That alone generated over 1.2 GB of data. The total number of events logged was 11003143, which almost perfectly matches with one allocation per row in the table. I can group by memory clerk to figure out what is doing the allocations:
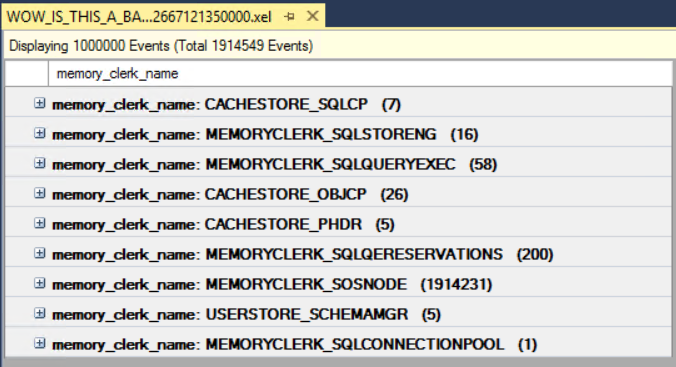
I’m able to find that clerk in one of the memory DMVs:
SELECT *
FROM sys.dm_os_memory_clerks c
where c.type = 'MEMORYCLERK_SOSNODE';
However, I’m unable to figure out how to do anything useful with those DMVs. It seems odd to me that memory clerks have one row per soft NUMA node instead of per hard NUMA node, but I can’t say anything more on that subject.
Putting everything together that we’ve seen so far, each call to the HASHBYTES function requires a call to something in the Windows assembly MEMORYCLERK_SOSNODE memory clerk within SQL Server needs to allocate and deallocate a page. Allocating and deallocating one page per row may not be a problem when running just one query, but it can lead to contention when running lots of queries. That contention may present itself within SQL Server as the MEMORY_ALLOCATION_EXT external wait type. On servers with LPIM enabled, this could be a large page and can result in trillions of spins on the SOS_LARGEPAGE_ALLOCATOR spinlock.
It may not be a coincidence that in total the workload does over a billion hashes and the total number of wait events for MEMORY_ALLOCATION_EXT is close to that.
What About Call Stacks?
We can get call stacks through Extended Events to further validate the theory. There are two possible triggers: page allocation and an external wait on MEMORY_ALLOCATION_EXT. For both triggers I see the same pattern in the call stack:
sqldk.dll!MemoryClerkInternal::AllocatePagesWithFailureMode+0x2ec
sqldk.dll!MemoryClerkInternal::AllocatePages+0x28
sqldk.dll!TVarPageMgr<0>::PviNewVarPage+0x36
sqldk.dll!TVarPageMgr<0>::PbAllocate+0x1e2
sqldk.dll!CMemObj::Alloc+0x47
sqllang.dll!CSECHash::GetHashValue+0x307
sqllang.dll!GetHashValue+0x25
sqllang.dll!HashBytes+0xb4
sqllang.dll!BytHashBytesByt+0xe3
I interpret that to mean that SQL Server needs to allocate a page for each execution of the HASHBYTES function. It isn’t conclusive evidence but it does match everything else that’s been observed so far.
Final Thoughts
I’m not able to find a workaround for this scalability problem. It’s unfortunate that SQL Server reports full CPU utilization when it experiences this contention. Without LPIM and a complete understanding of expected run time for queries running on the system, an administrator may underestimate the importance of the MEMORY_ALLOCATION_EXT wait times. I was able to observe contention even when running just a few queries at a time, both on the test server and on my laptop. It is even more difficult to observe the problem within SQL Server when running just a few queries. I don’t understand everything that’s involved, but it’s hard not to conclude that HASHBYTES could see significantly improved scalability if it wasn’t necessary to allocate and deallocate a page for every execution of the function.
Thanks for reading!
Going Further
If this is the kind of SQL Server stuff you love learning about, you’ll love my training. I’m offering a 75% discount to my blog readers if you click from here. I’m also available for consulting if you just don’t have time for that and need to solve performance problems quickly.