Mind Loss
Microsoft has invested some engineering time in the plumbing behind Query Store in SQL Server 2022. Really cool stuff, like the ability to add hints to a query and force it to use the plan with that hint in place.
That’s going to solve a crazy amount of problems for me, with queries that I can’t actually touch (and not because they’re priceless works of art).
But… the front end of Query Store still hasn’t changed. It’s clunky, it’s ugly, it’s not very configurable, and I find it downright unfriendly.
It can also be really slow and, golly and gosh, the number of times I’ve seen the queries that fill in the GUI show up in there is sort of depressing.
So I wrote sp_QuickieStore to fill in the gaps. No, it doesn’t populate a GUI (I don’t have those chops), but it does get you actionable results pretty quickly.
Explain Plan
By default, sp_QuickieStore will give you the top ten queries in query store by average CPU over the last 24 hours. I’m going to talk about other things you can do with it later this week.
For now, let’s just look at the first thing you see when you run it without any additional parameters. Most folks will stick sp_QuickieStore in the master database, but Query Store can only be turned on in user databases.
Of course, sp_QuickieStore has a parameter to tell it which database you want to analyze (@database_name). It’d be utterly insane for me to ask you, dear user, to install it in every user database.
The nice thing is that if you run sp_QuickieStore from a user database context, it will assume that that’s the database you want to analyze Query Store in.
EXEC sp_QuickieStore;
Right up front, you get the stuff that helps you figure out if you want to dig any deeper:

There’s a lot more information if you keep scrolling to the right that’ll tell you about resource usage, but here’s what you get:
- query_id: how Query Store identifies the query text
- plan_id: how Query Store identifies the query plan
- all_plan_ids: if your query has generated multiple plans, you’ll get a CSV list of them here
- execution_type_desc: if you query ran successfully or not
- object_name: if your query came from a store procedure
- query_sql_text: XML clickable of the query text
- compatibility_level: uh… compatibility level
- query_plan plan_forcing_type_desc: if Query Store is forcing a plan
- top_waits: the high-level wait stats that your query has generated
- first_execution_time: um… c’mon
- last_execution_time: don’t make me say it
- count_executions: oh gosh darn it to heck.
By The Numbers
There’s plenty for you to think about up there. Most folks know if they care about something by looking at some combination of object_name and query_sql_text. Sometimes count_executions will come into play.
Other times, you might have no idea what you’re looking at or why it’s showing up here. And baby. Baby, baby, baby. I am here for you.
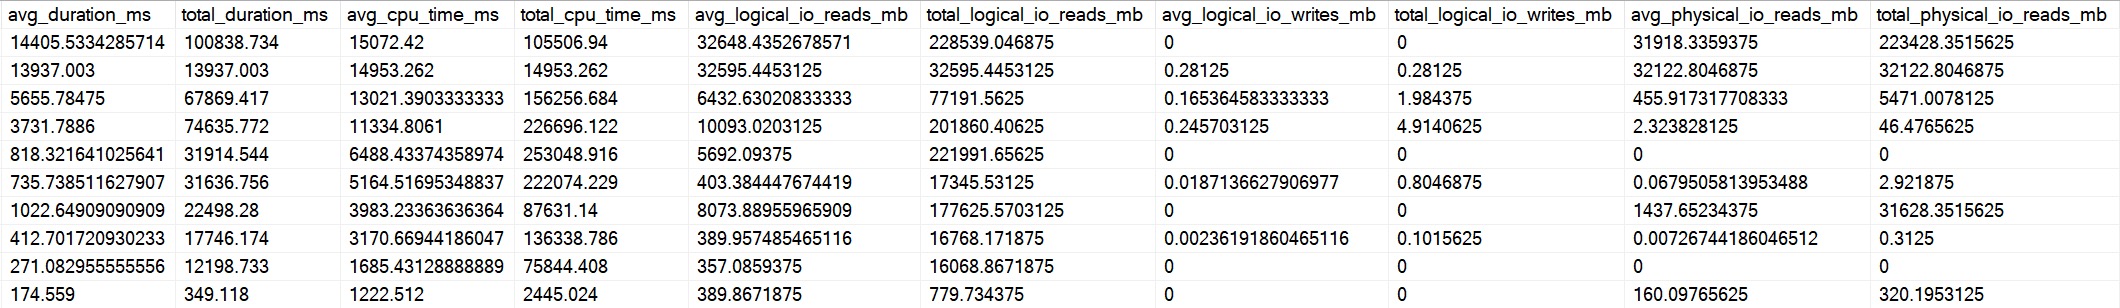
These results are sorted by average CPU (that’s the default, remember), but there’s plenty of other memes here like logical reads for you to nod at sagely.
Something for everyone, really.
All this stuff is nice, but… Maybe you need something more. Maybe you’re searching for something in particular, maybe you want the results to look a little different, or uh… maybe you want to be an expert.
I would also love to be an expert. I would tell people expert things like “don’t throw eggs”.
Thanks for reading!
Going Further
If this is the kind of SQL Server stuff you love learning about, you’ll love my training. I’m offering a 75% discount to my blog readers if you click from here. I’m also available for consulting if you just don’t have time for that, and need to solve database performance problems quickly. You can also get a quick, low cost health check with no phone time required.
Related Posts
- How To Find Poorly Performing SQL Server Queries To Tune Using Query Store
- SQL Server Community Tools: The Wrap Up And Combined Link
- SQL Server Community Tools: How To Dig Deeper With Expert Mode With sp_QuickieStore
- SQL Server Community Tools: Formatting sp_QuickieStore Output So It’s Easier To Understand