Sponsor
People are always surprised by how SQL Server uses, and misuses, memory. First, there are misconceptions about how much memory Standard Edition can use — everyone thinks it’s 128GB — but that’s just for the buffer pool.
Sometimes they have no idea that…
- SQL Server caches data pages in memory (buffer pool)
- SQL Server doesn’t work with pages on disk (except to read them into memory)
- SQL Server queries can ask for TONS of memory that gets pulled from the buffer pool
- SQL Server uses memory to manage other things, like locks, caching query plans, compressed backups, and more
So that’s the type of stuff that I thought would be good to expose with sp_PressureDetector.
To look at just memory stuff with it, run this:
EXEC sp_PressureDetector
    @what_to_check = 'memory';
Simple as.
Trudging
When SQL Server is under memory pressure, it can show up in a few different places, just like CPU pressure.
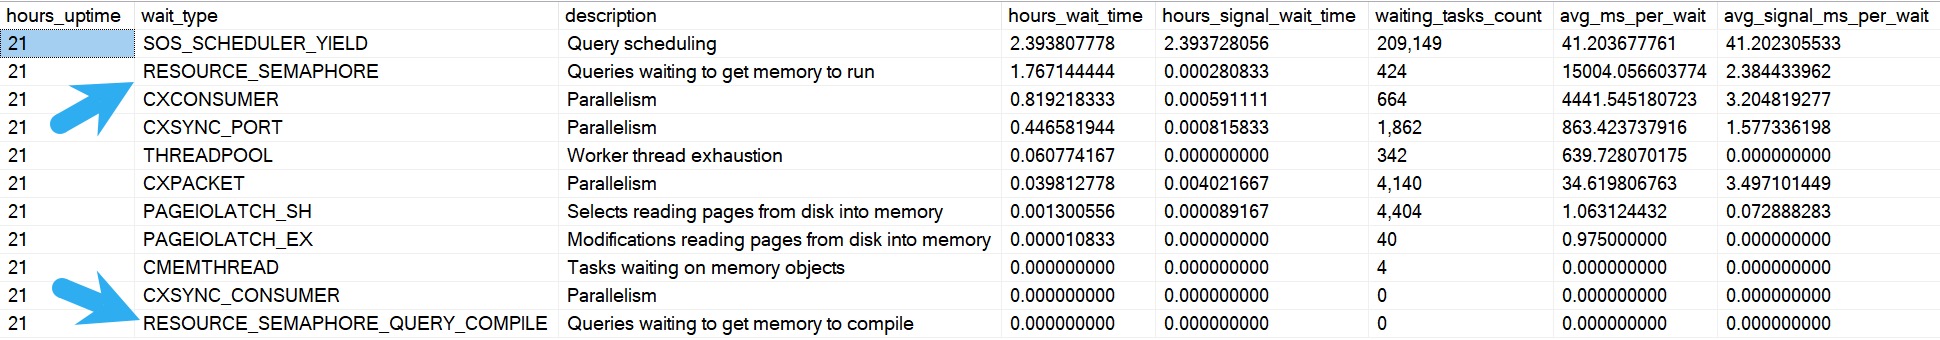
The arrows are pointing to two wait types that are directly related to queries waiting on memory. Read the description column for more detail ;^}
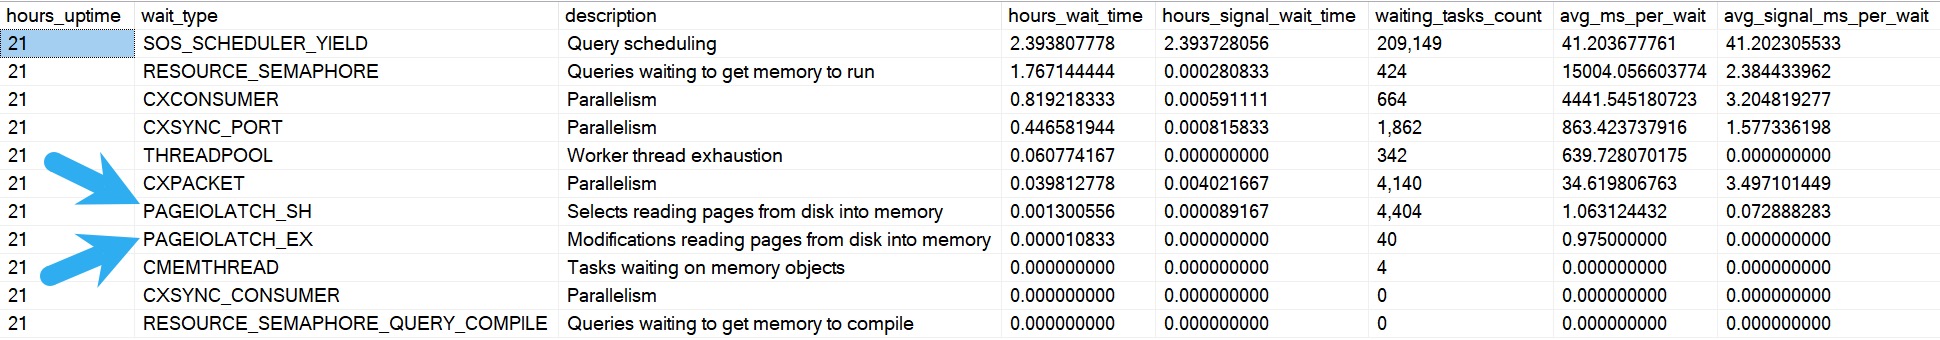
But that’s not the whole story, because like I said above, SQL Server uses memory for a bunch of stuff. If there’s memory pressure on the server, you’ll also see SQL Server having to go out to disk a whole bunch.
Stolen
SQL Server surfaces what things are consuming memory, too. I show that early on in the results.
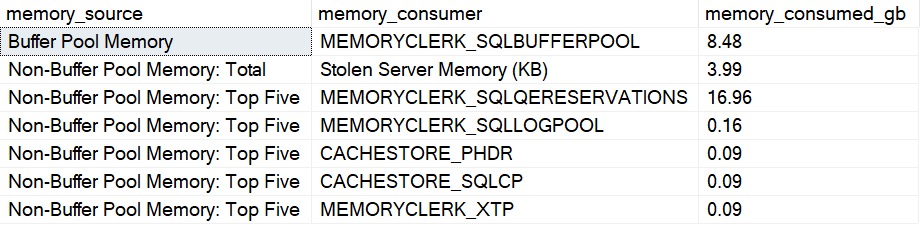
My server isn’t very busy at the moment, so these numbers are fairly low, but this gives you a pretty good breakdown of:
- How much memory is dedicated to the buffer pool
- How much memory is stolen from the buffer pool
- How much memory other consumers are taking up
You can match some of that up with other results that get returned that show more detail on query memory grants:

It doesn’t match exactly because there’s a little time between when each query runs, but the granted_memory and used_memory columns are close-enough to the MEMORYCLERK_SQLQERESERVATIONS and Stolen Server Memory (KB) lines in the other results shown here.
If you’re paying really close attention, you may notice that 17GB of memory has been given to three queries, and 197 queries are waiting on memory.
In tomorrow’s post, we’ll look at how sp_PressureDetector surfaces queries that are most likely involved in CPU and memory pressure.
Thanks for reading!
Going Further
If this is the kind of SQL Server stuff you love learning about, you’ll love my training. I’m offering a 75% discount to my blog readers if you click from here. I’m also available for consulting if you just don’t have time for that, and need to solve database performance problems quickly. You can also get a quick, low cost health check with no phone time required.
Related Posts
- SQL Server Community Tools: The Wrap Up And Combined Link
- SQL Server Community Tools: Why Does sp_PressureDetector Make A Big Deal About The Remote DAC?
- SQL Server Community Tools: sp_PressureDetector Doesn’t Show You Irrelevant Waits
- SQL Server Community Tools: sp_PressureDetector Shows You Running Queries Taking Up CPU And Memory