How Indexes Talk To Each Other In SQL Server

Connections


When one thinks of effective communicators, indexes aren’t usually at the top of the list. And for good reason!

They’re more the strong, silent type. Like Gary Cooper, as a wiseguy once said. But they do need to talk to each other, sometimes.

For this post, I’m going to focus on tables with clustered indexes, but similar communication can happen with the oft-beleaguered heap tables, too.

Don’t believe me? Follow along.

Clustered


This post is going to focus on a table called Users, which has a bunch of columns in it, but the important thing to start with is that it has a clustered primary key on a column called Id.

Shocking, I know.

 CONSTRAINT PK_Users_Id 
 PRIMARY KEY CLUSTERED 
(
    Id ASC
)

But what does adding that do, aside from put the table into some logical order?

The answer is: lots! Lots and lots. Big lots (please don’t sue me).

Inheritance


The first thing that comes to my mind is how nonclustered indexes inherit that clustered index key column.

Let’s take a look at a couple examples of that. First, with a couple single key column indexes. The first one is unique, the second one is not.

/*Unique*/
CREATE UNIQUE INDEX 
    whatever_uq 
ON dbo.Users 
    (AccountId)
WITH
    (MAXDOP = 8, SORT_IN_TEMPDB = ON, DATA_COMPRESSION = PAGE);


/*Not unique*/
CREATE INDEX 
    whatever_nuq 
ON dbo.Users 
    (AccountId)
WITH
    (MAXDOP = 8, SORT_IN_TEMPDB = ON, DATA_COMPRESSION = PAGE);

For these queries, pay close attention to the where clause. We’re searching on both the AccountId column that is the only column defined in our index, and the Id column, which is the only column in our clustered index.

SELECT
    records = COUNT(*)
FROM dbo.Users AS u WITH (INDEX = whatever_uq)
WHERE u.AccountId = 1
AND   u.Id = 1;

SELECT
    records = COUNT(*)
FROM dbo.Users AS u WITH (INDEX = whatever_nuq)
WHERE u.AccountId = 1
AND   u.Id = 1;

The query plans are slightly different in how the searches can be applied to each index.
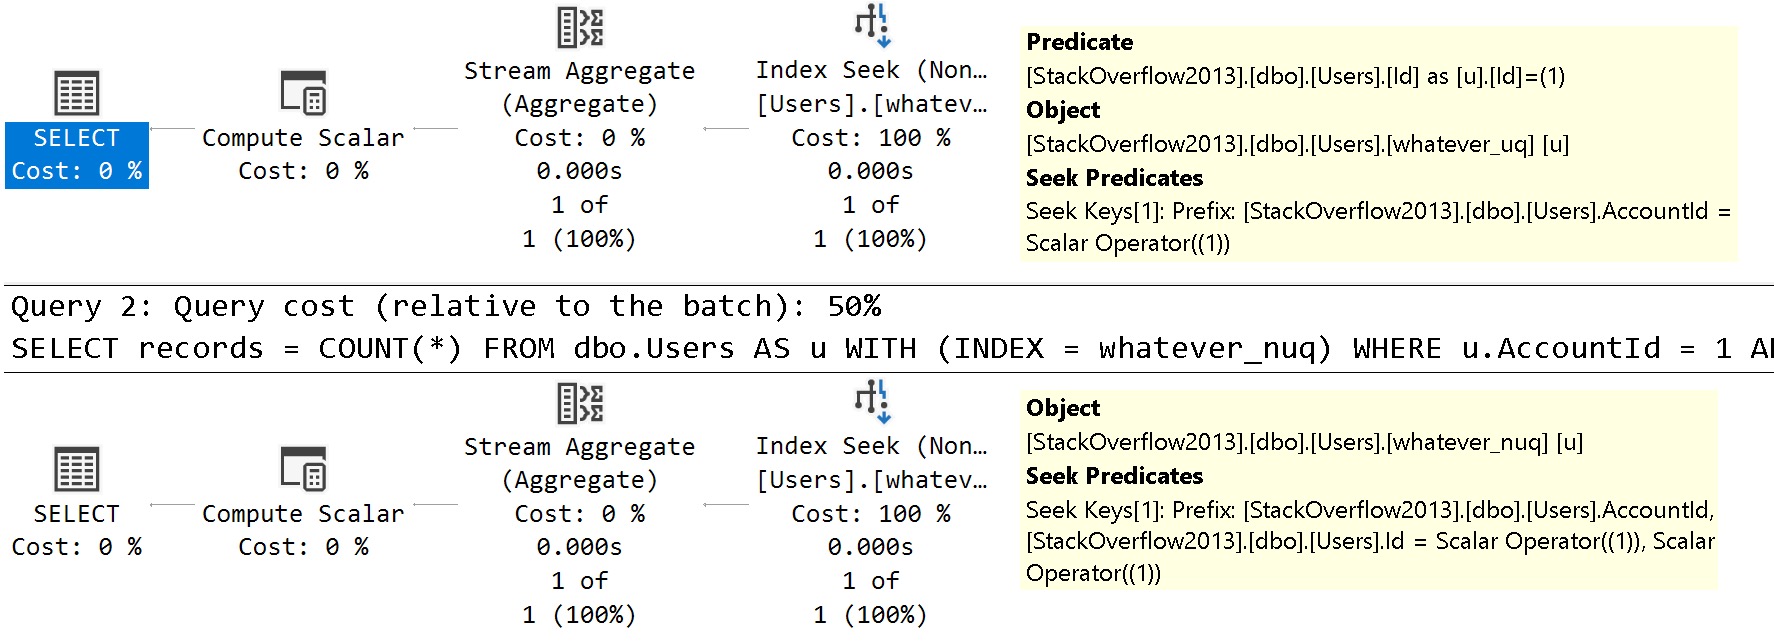
SQL Server Query Plan
dedicated

See the difference?

  • In the unique index plan, there is one seek predicate to AccountId, and one residual predicate on Id
  • In the non-unique index plan, there are two seeks, both to AccountId and to Id

The takeaway here is that unique nonclustered indexes inherit clustered index key column(s) are includes, and non-unique nonclustered indexes inherit them as additional key columns.

Fun!

Looky, Looky


Let’s create two nonclustered indexes on different columns. You know, like normal people. Sort of.

I don’t usually care for single key column indexes, but they’re great for simple demos. Remember that, my lovelies.

CREATE INDEX
    l
ON dbo.Users
    (LastAccessDate)
WITH
    (MAXDOP = 8, SORT_IN_TEMPDB = ON, DATA_COMPRESSION = PAGE);

CREATE INDEX
    c
ON dbo.Users
    (CreationDate)
WITH
    (MAXDOP = 8, SORT_IN_TEMPDB = ON, DATA_COMPRESSION = PAGE);

How will SQL Server cope with all that big beautiful index when this query comes along?

SELECT
    c = COUNT_BIG(*)
FROM dbo.Users AS u
WHERE u.CreationDate  >= '20121231'
AND   u.LastAccessDate < '20090101';

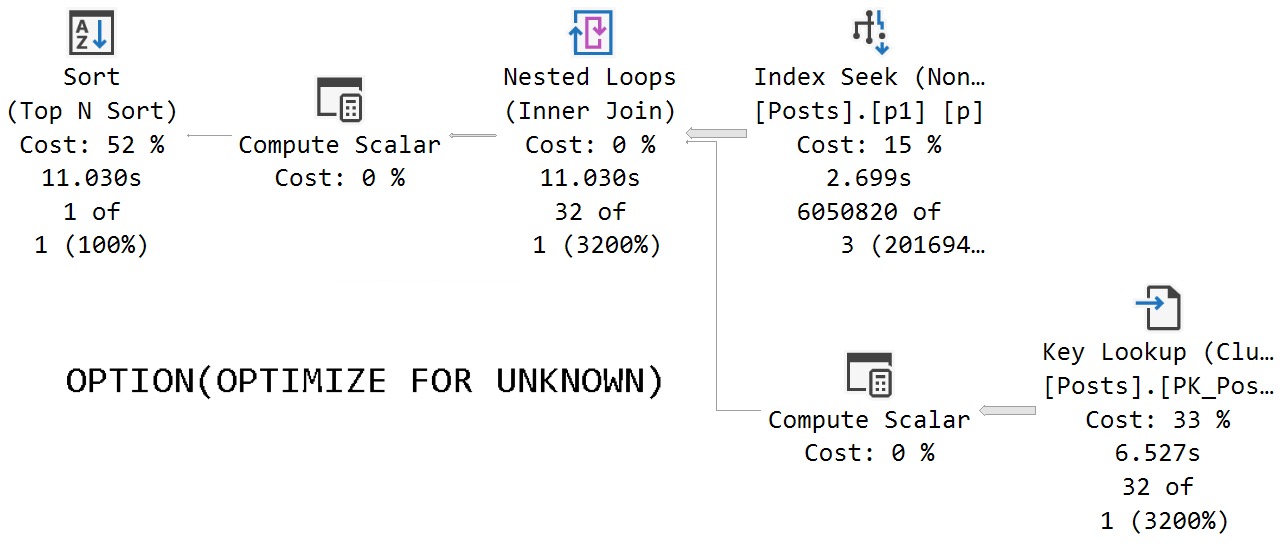
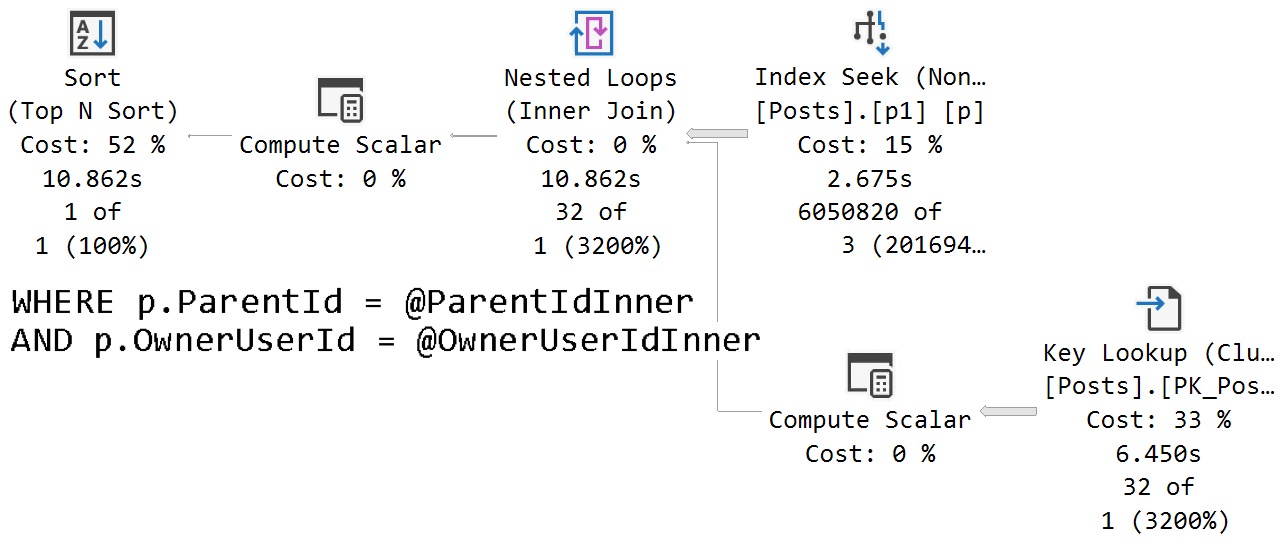
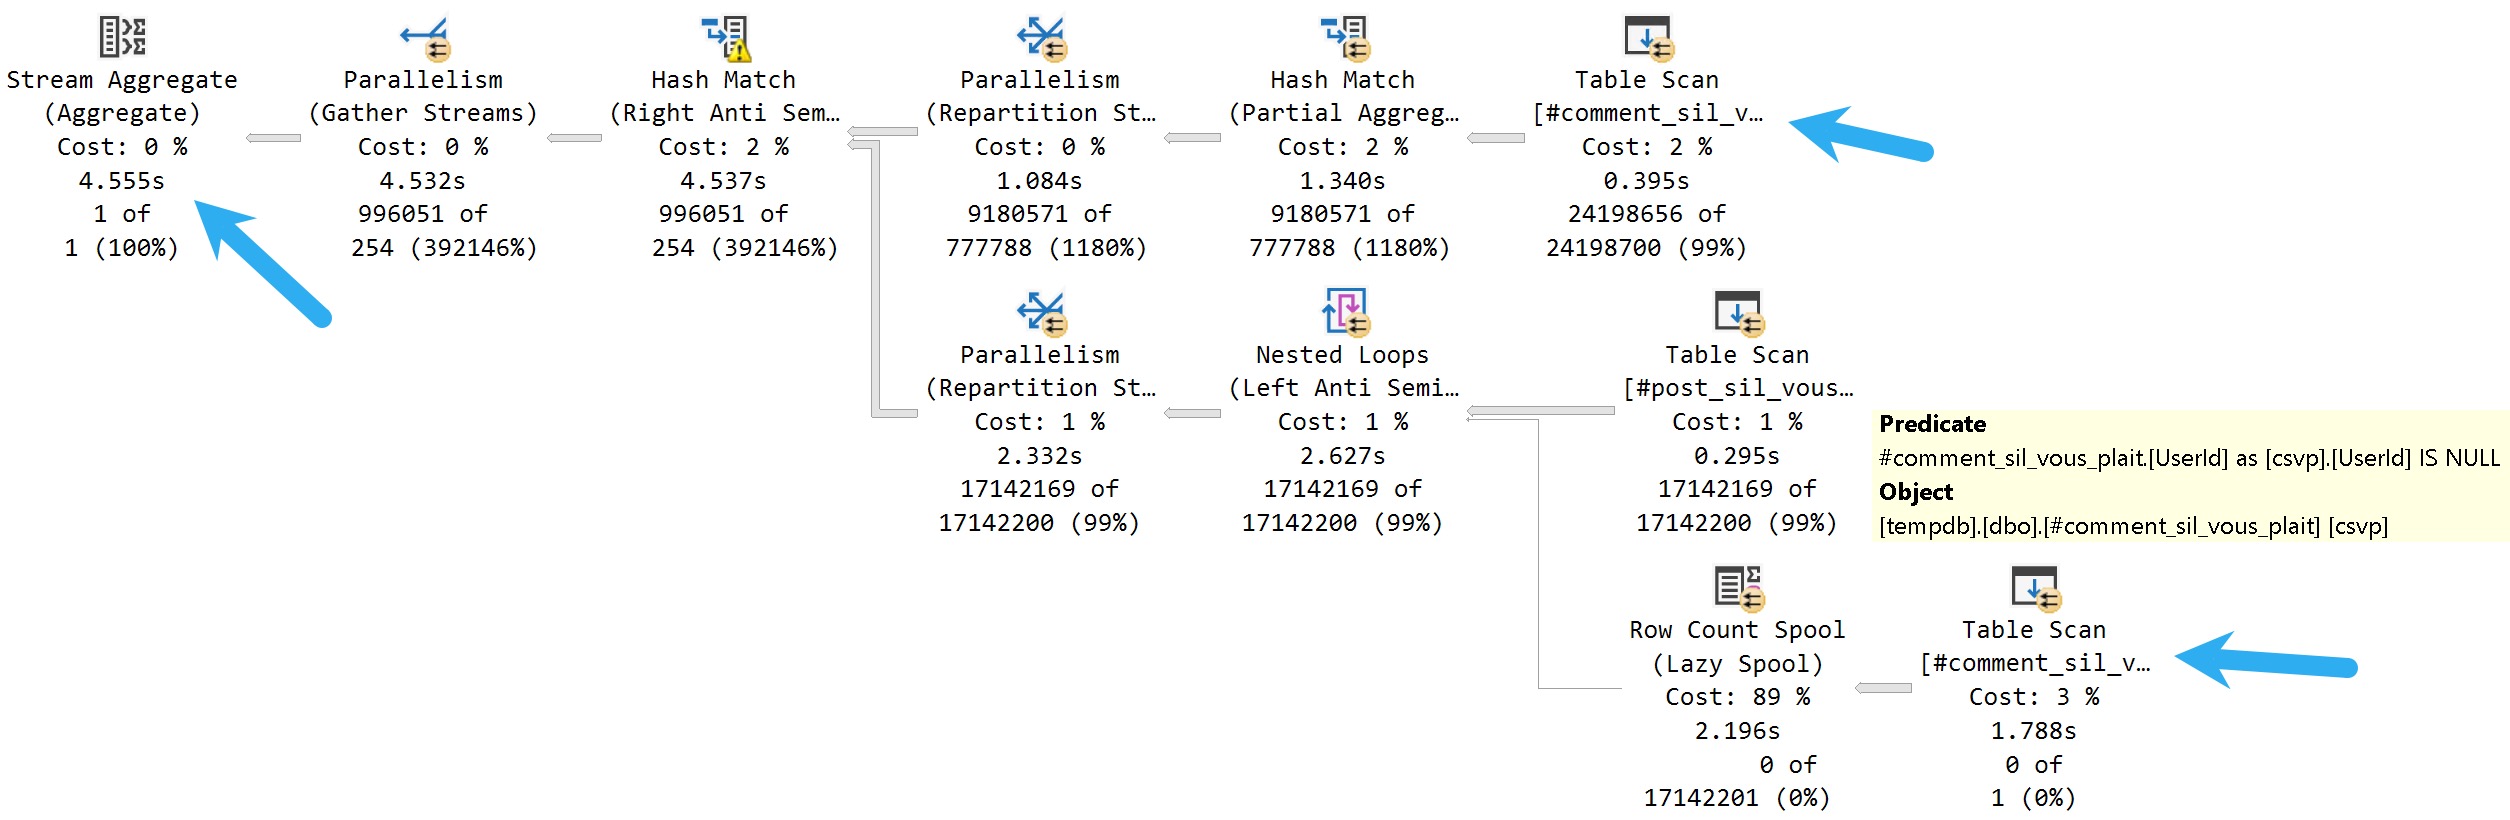
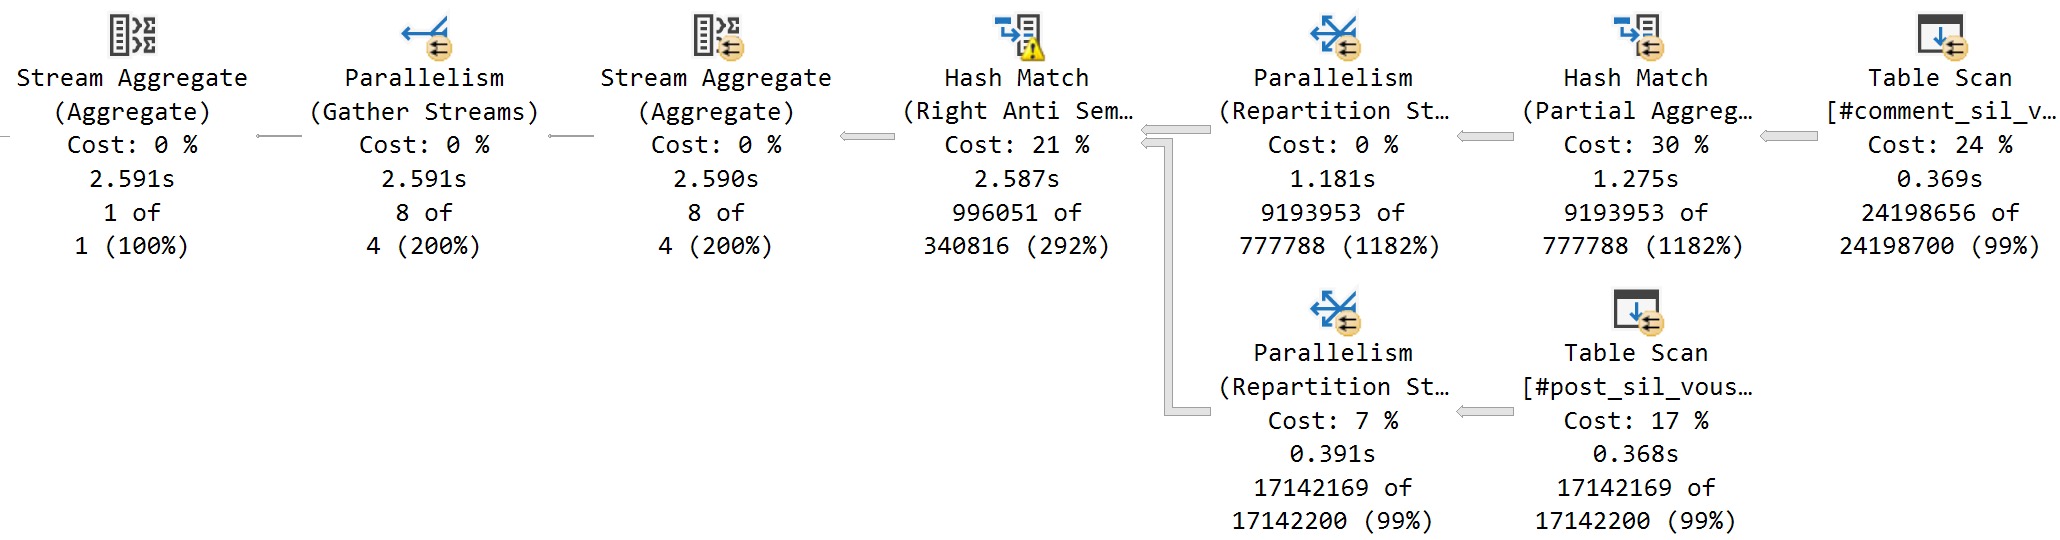
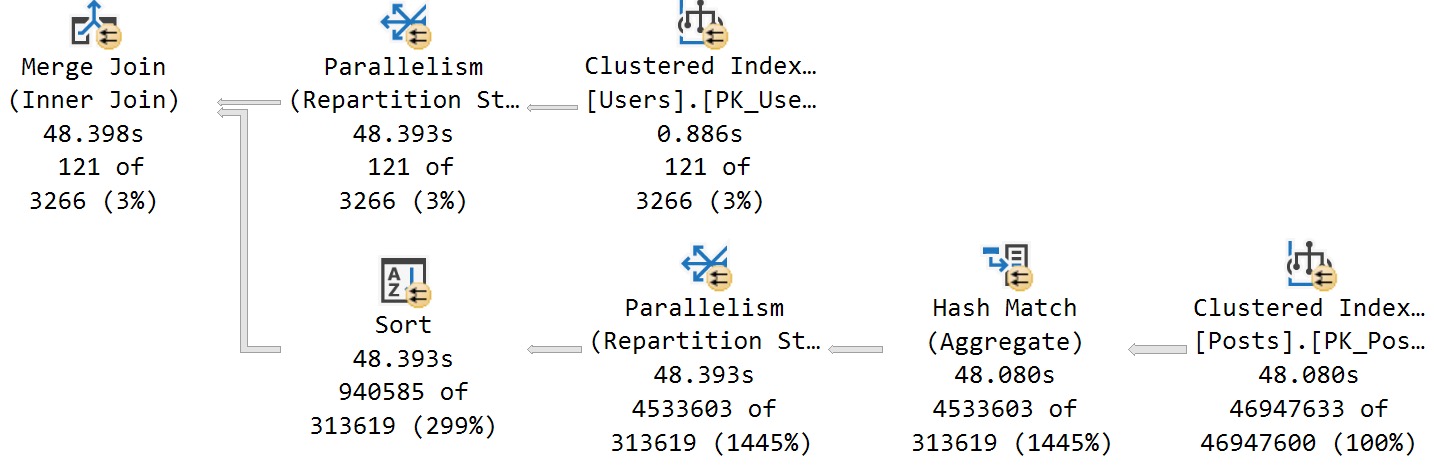
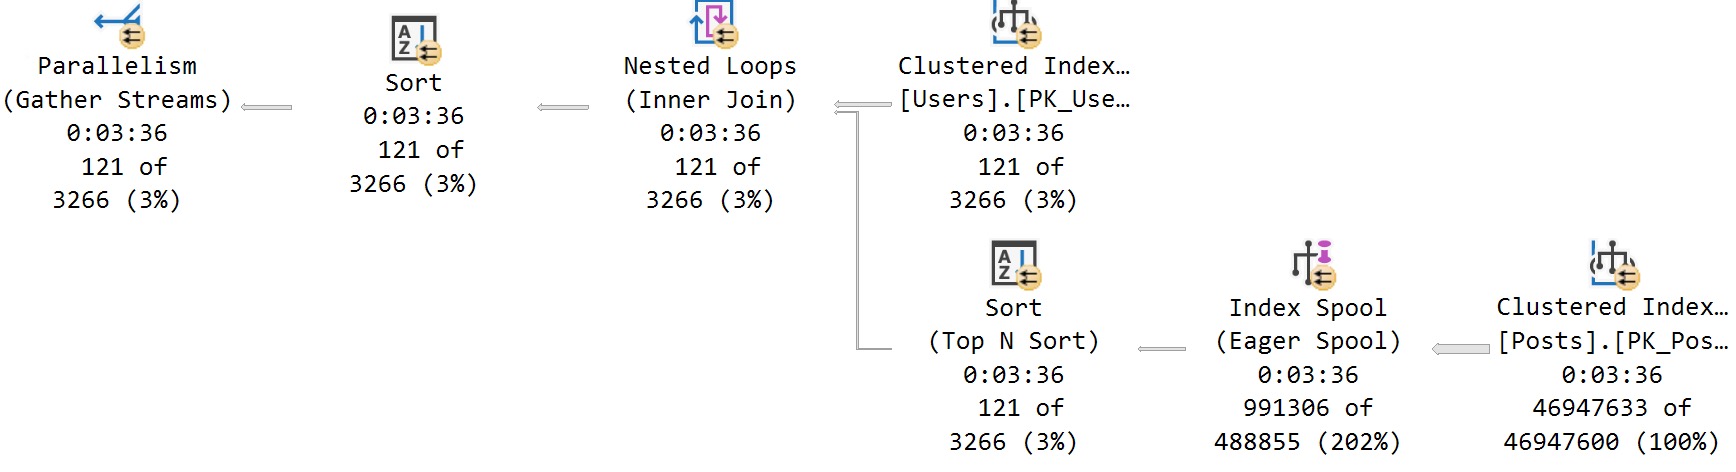
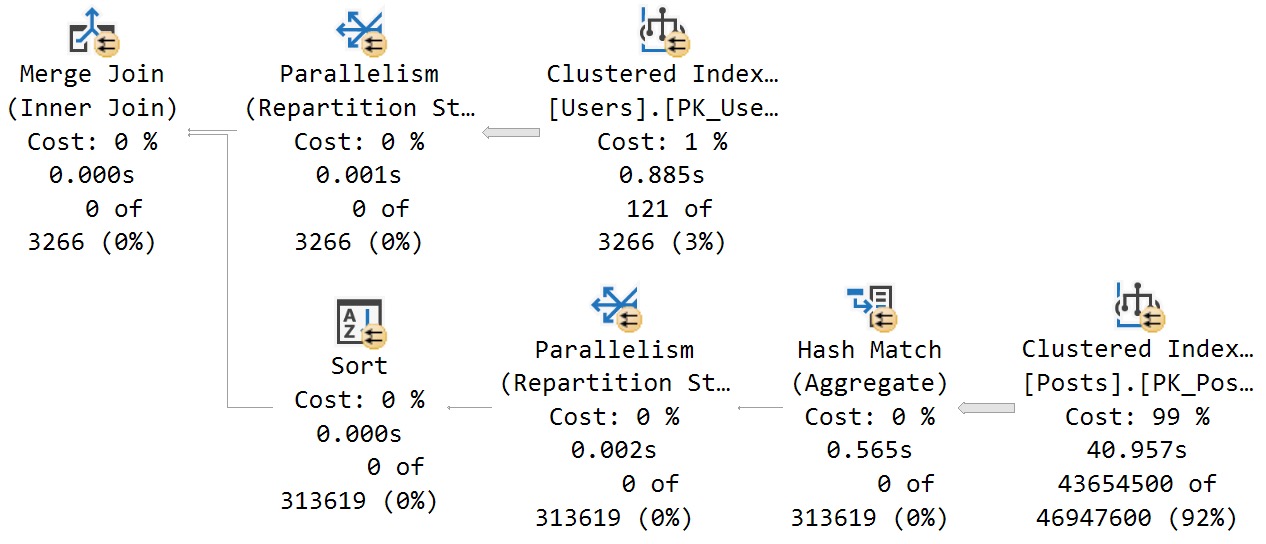
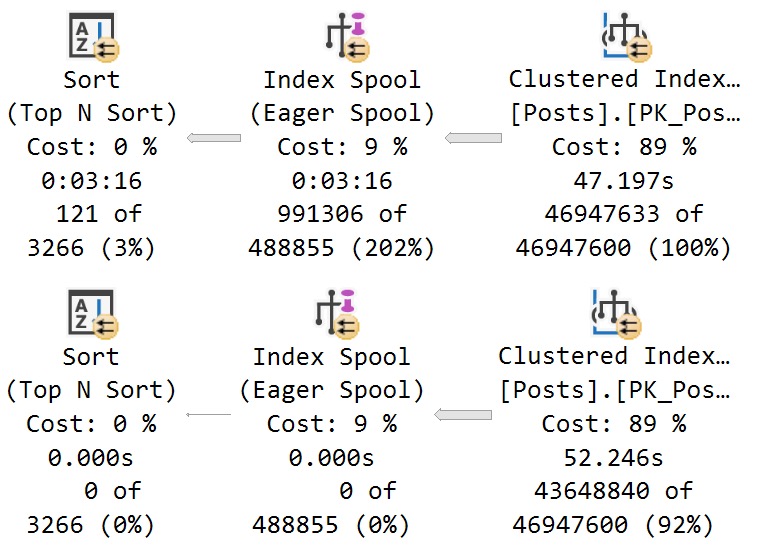
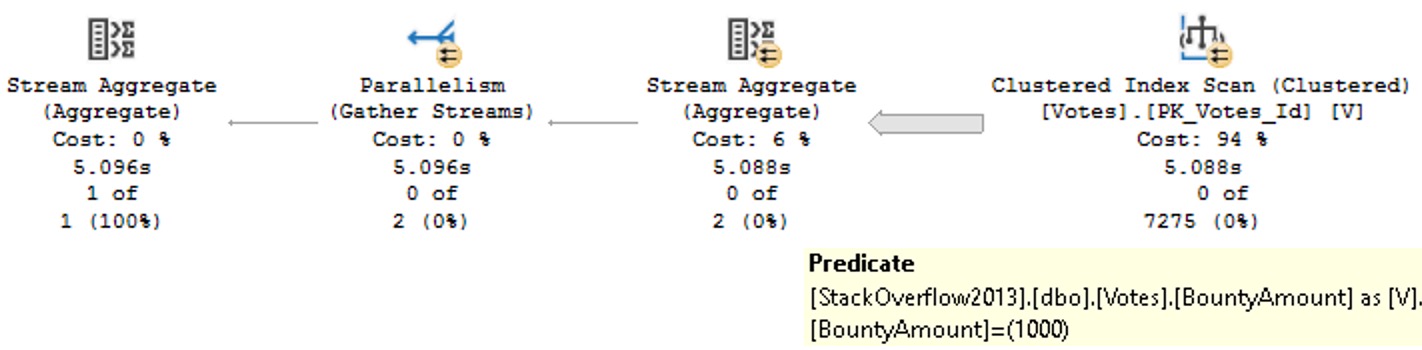
How about this bold and daring query plan?

SQL Server Query Plan
indexified!

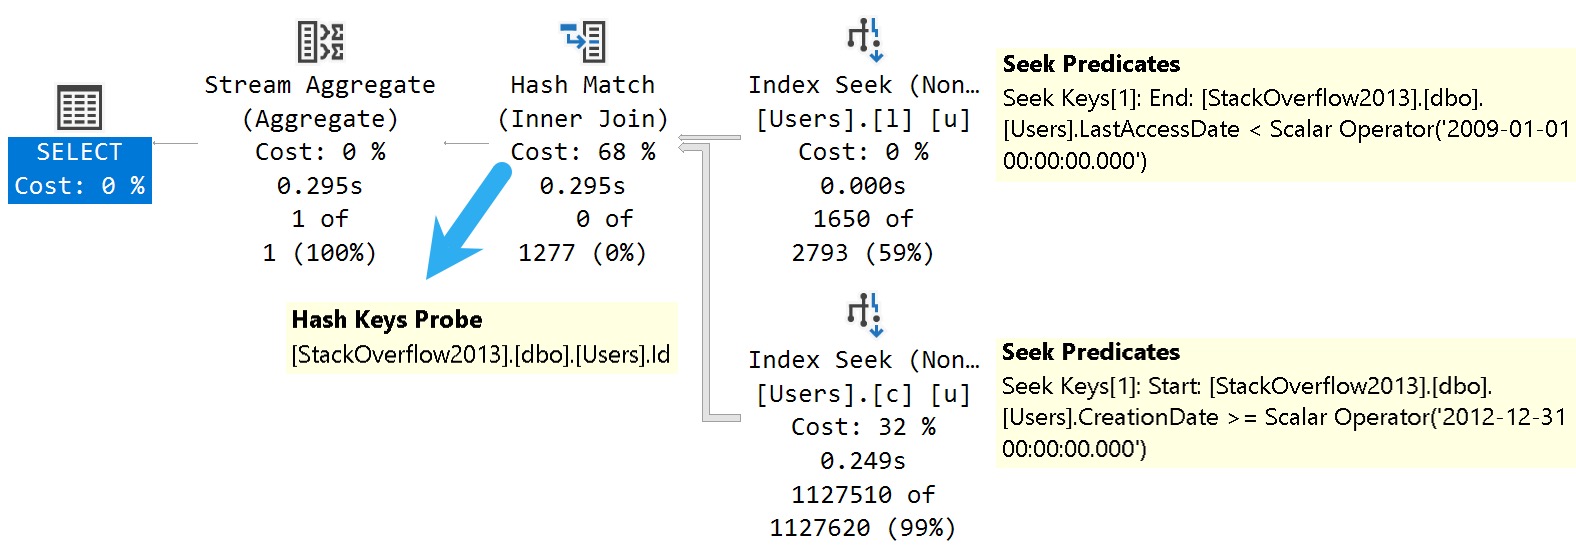
SQL Server joins two nonclustered indexes together on the clustered index column that they both inherited. Isn’t that nice?

Danes


More mundanely, this is the mechanism key lookups use to work, too. If we change the last query a little bit, we can see a great example of one.

SELECT
    u.*
FROM dbo.Users AS u
WHERE u.CreationDate  >= '20121231'
AND   u.LastAccessDate < '20090101';

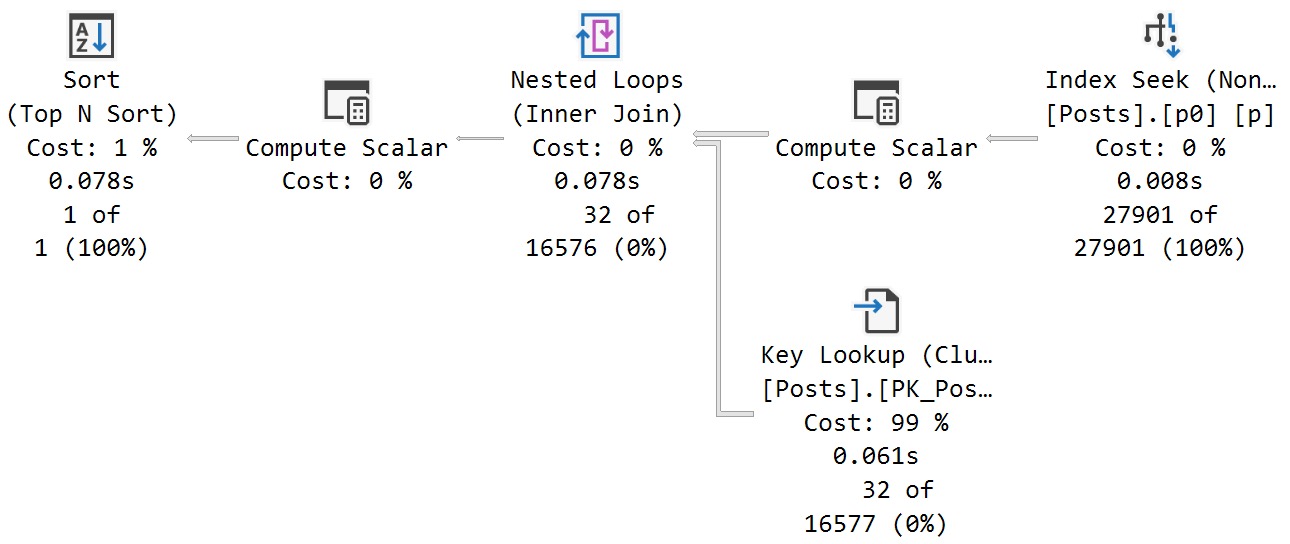
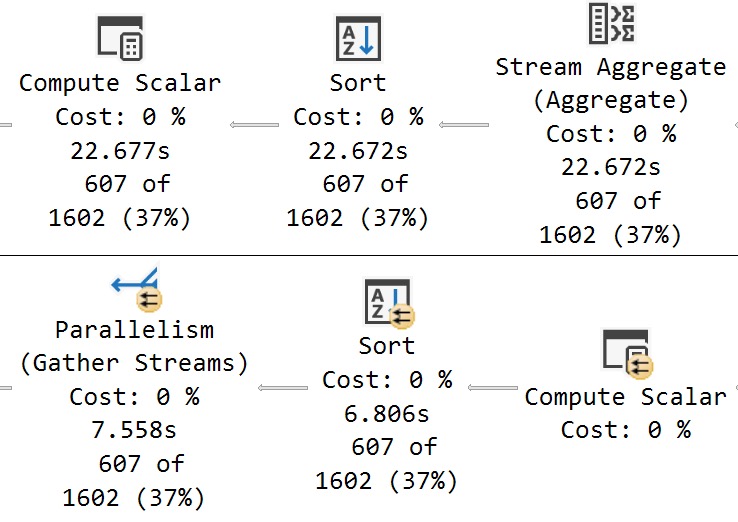
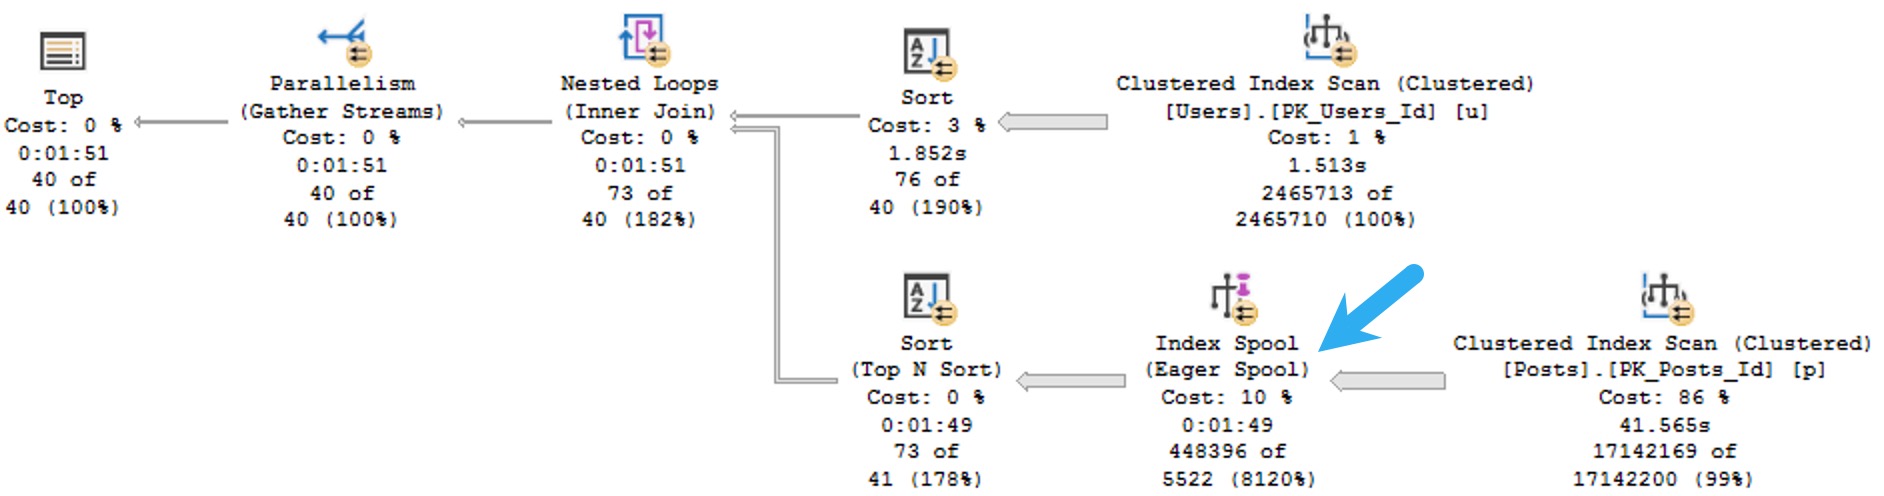
Selecting all the columns from the Users table, we get a different query plan.

SQL Server Query Plan
uplook

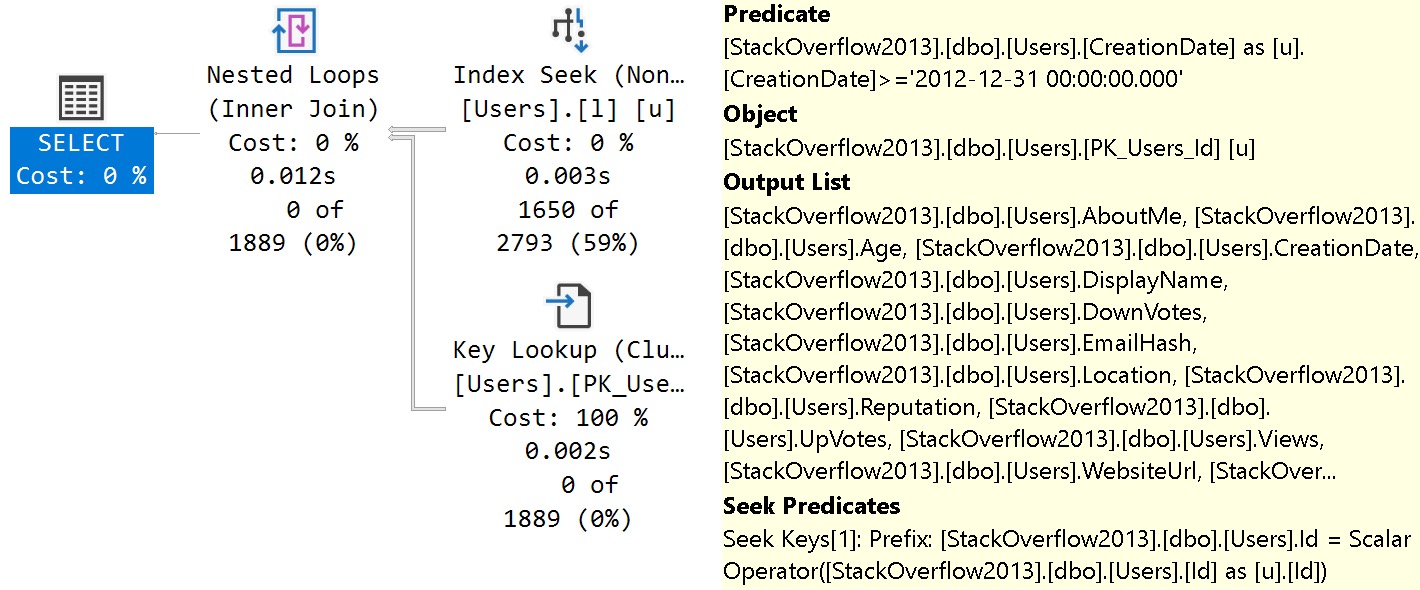
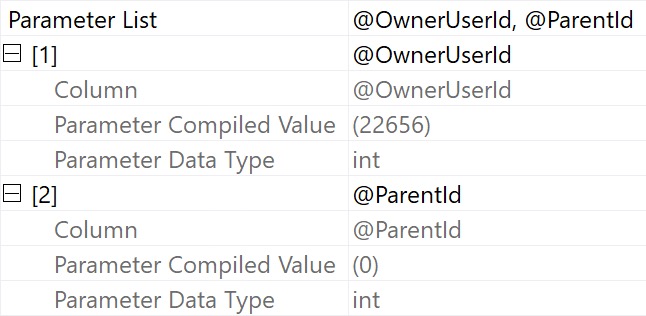
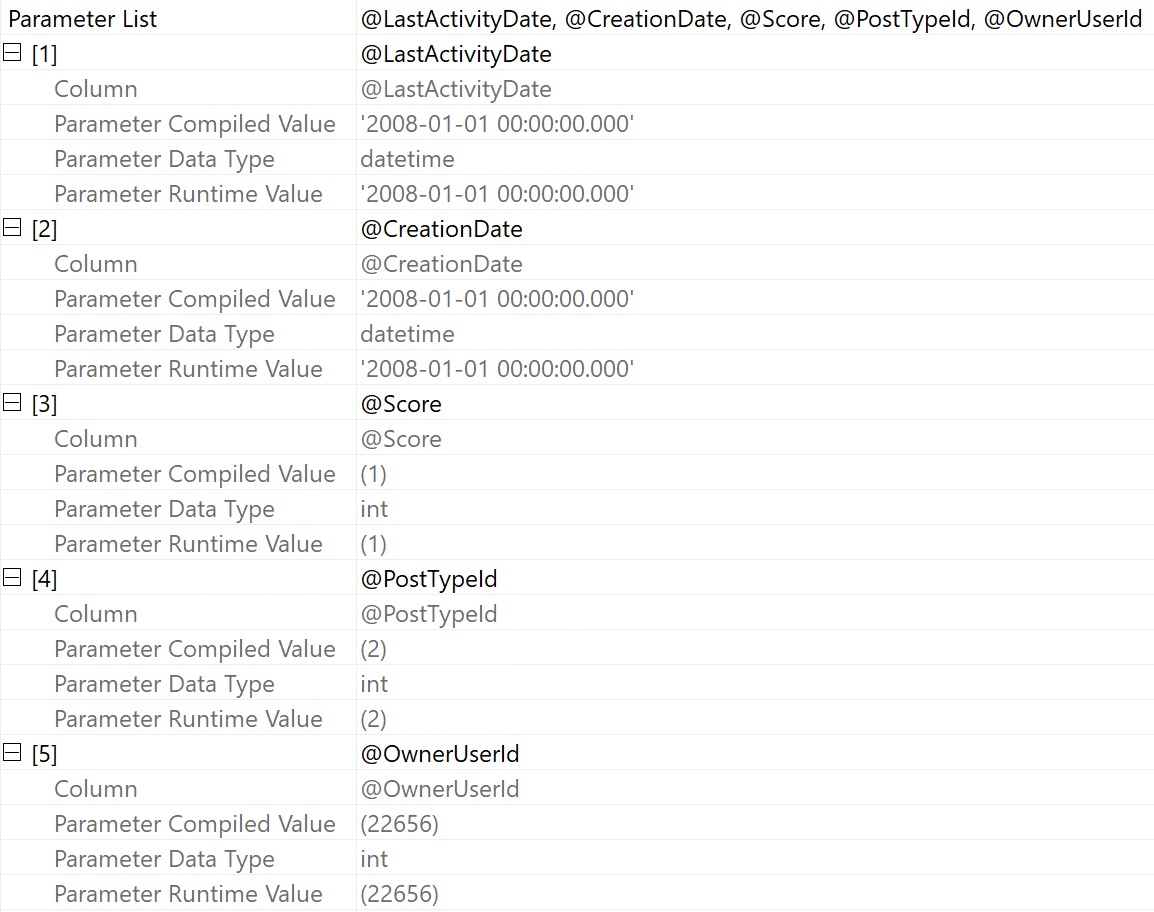
The tool tip pictured above is detail from the Key Lookup operator. From the top down:

  • Predicate is the additional search criteria that we couldn’t satisfy with our index on Last Access Date
  • Object is the index being navigated (clustered primary key)
  • Output list is all the columns we needed from the index
  • Seek Predicates define the relationship between the clustered and nonclustered index, in this case the Id column

And this is how indexes talk to each other in SQL Server. Yay.

Thanks for reading!

Going Further


If this is the kind of SQL Server stuff you love learning about, you’ll love my training. I’m offering a 75% discount to my blog readers if you click from here. I’m also available for consulting if you just don’t have time for that, and need to solve database performance problems quickly. You can also get a quick, low cost health check with no phone time required.

Why SQL Server’s OPTIMIZE FOR UNKNOWN Hint Hurts Performance

“Best Practice”


It’s somewhat strange to hear people carry on about best practices that are actually worst practices.

One worst practice that has strong staying power is the OPTIMIZE FOR UNKNOWN hint, which we talked about yesterday.

It probably doesn’t help that Microsoft has products (I’m looking at you, Dynamics) which have a setting to add the hint to every query. Shorter: If Microsoft recommends it, it must be good.

Thanks, Microsoft. Dummies.

Using the OPTIMIZE FOR UNKNOWN hint, or declaring variables inside of a code block to be used in a where clause have the same issue, though: they make SQL Server’s query optimizer make bad guesses, which often lead to bad execution plans.

You can read great detail about that here.

Mistakenly


We’re going to create two indexes on the Posts table:

CREATE INDEX
    p0
ON dbo.Posts
(
    OwnerUserId
)
WITH
(
    SORT_IN_TEMPDB = ON,
    DATA_COMPRESSION = PAGE
);
GO

CREATE INDEX
    p1
ON dbo.Posts
(
    ParentId,
    CreationDate,
    LastActivityDate
)
INCLUDE
(
    PostTypeId
)
WITH
(
    SORT_IN_TEMPDB = ON,
    DATA_COMPRESSION = PAGE
);
GO

The indexes themselves are not as important as how SQL Server goes about choosing them.

Support Wear


This stored procedure is going to call the same query in three different ways:

  • One with the OPTIMIZE FOR UNKNOWN hint that uses parameters
  • One with local variables set to parameter values with no hints
  • One that accepts parameters and uses no hints
CREATE OR ALTER PROCEDURE
    dbo.unknown_soldier
(
    @ParentId int,
    @OwnerUserId int
)
AS
BEGIN
SET NOCOUNT, XACT_ABORT ON;

    SELECT TOP (1)
        p.*
    FROM dbo.Posts AS p
    WHERE p.ParentId = @ParentId
    AND   p.OwnerUserId = @OwnerUserId
    ORDER BY
        p.Score DESC,
        p.Id DESC
    OPTION(OPTIMIZE FOR UNKNOWN);

    DECLARE
        @ParentIdInner int = @ParentId,
        @OwnerUserIdInner int = @OwnerUserId;

    SELECT TOP (1)
        p.*
    FROM dbo.Posts AS p
    WHERE p.ParentId = @ParentIdInner
    AND   p.OwnerUserId = @OwnerUserIdInner
    ORDER BY
        p.Score DESC,
        p.Id DESC;

    SELECT TOP (1)
        p.*
    FROM dbo.Posts AS p
    WHERE p.ParentId = @ParentId
    AND   p.OwnerUserId = @OwnerUserId
    ORDER BY
        p.Score DESC,
        p.Id DESC;

END;
GO

Placebo Effect


If we call the stored procedure with actual execution plans enabled, we get the following plans back.

EXEC dbo.unknown_soldier 
    @OwnerUserId = 22656, 
    @ParentId = 0;
SQL Server Query Plan With Optimize For Unknown Hint
Not a good guess.

The assumed selectivity that the OPTIMIZE FOR UNKNOWN hint produces as a cardinality estimate is way off the rails.

SQL Server thinks three rows are going to come back, but we get 6,050,820 rows back.

We get identical behavior from the second query that uses variables declared within the stored procedure, and set to the parameter values passed in.

SQL Server Query Plan With Local Variables
release me

Same poor guesses, same index choices, same long running plan.

Parameter Effect


The query that accepts parameters and doesn’t have any hints applied to it fares much better.

SQL Server Query Plan
transporter

In this case, we get an accurate cardinality estimate, and a more suitable index choice.

Note that both queries perform lookups, but this one performs far fewer of them because it uses an index that filters way more rows out prior to doing the lookup.

The optimizer is able to choose the correct index because it’s able to evaluate predicate values against the statistics histograms rather than using the assumed selectivity guess.

Thanks for reading!

Going Further


If this is the kind of SQL Server stuff you love learning about, you’ll love my training. I’m offering a 75% discount to my blog readers if you click from here. I’m also available for consulting if you just don’t have time for that, and need to solve database performance problems quickly. You can also get a quick, low cost health check with no phone time required.

Why Are Parameter Details Missing From SQL Server Execution Plans?

Compiled


For a long while now, when parameterized queries get executed in SQL Server, whether they’re in stored procedures or from ORMs, execution plans stored in the plan cache or in query store will keep information about what the compile-time parameter values are.

You can see this list in the details of the query plan by going to the properties of whatever the root node is.

SQL Server Query Plan Properties
compile time, baby!

This is useful for when you want to execute the code to reproduce and address any performance issues.

You know, very professional stuff.

If you use local variables, apply the OPTIMIZE FOR UNKNOWN hint, or disable parameter sniffing using a database scoped configuration, cached and query store-d plans no longer have those parameters lists in them. Likewise, if you have queries where a mix of parameters and local variables are used, the local variable compile time values will be missing from the plan XML.

Thanks for reading!

Going Further


If this is the kind of SQL Server stuff you love learning about, you’ll love my training. I’m offering a 75% discount to my blog readers if you click from here. I’m also available for consulting if you just don’t have time for that, and need to solve database performance problems quickly. You can also get a quick, low cost health check with no phone time required.

SQL Server 2022: FORCE_SHOWPLAN_RUNTIME_PARAMETER_COLLECTION

Mouthful


SQL Server 2022 is kind of a boring release. I had high hopes that it would be a rich environment for new blog material, like other releases have been (Except SQL Server 2014. We don’t talk about SQL Server 2014.), but for performance tuners, it’s largely just some more layers of crap tacked on top of of an already complex set of adaptations and automations to sift through when tracking down performance issues.

One thing that apparently hasn’t caught anyone’s eye is the FORCE_SHOWPLAN_RUNTIME_PARAMETER_COLLECTION database scoped configuration, which could come in handy when troubleshooting parameter sniffing problems that… SQL Server 2022 claims to solve.

Well, okay then. It also comes with this horrifying, terrifying, sky-is-falling note:

The FORCE_SHOWPLAN_RUNTIME_PARAMETER_COLLECTION database scoped configuration option isn’t meant to be enabled continuously in a production environment, but only for time-limited troubleshooting purposes. Using this database scoped configuration option will introduce additional and possibly significant CPU and memory overhead as we will create a Showplan XML fragment with runtime parameter information[…]

So, I guess don’t flip this on if you’re already having CPU and memory problems potentially caused by parameter sniffing scenarios and you need to troubleshoot long running queries?

Hm. I guess I can see why this isn’t lighting the blogopshere on fire.

Enablement


If you’re running SQL Server 2022, and you’re feeling brave, you can flip this thing on like so:

ALTER DATABASE SCOPED CONFIGURATION 
    SET FORCE_SHOWPLAN_RUNTIME_PARAMETER_COLLECTION = ON;

Now, the big question becomes: how do you see all this super helpful information at the cost of additional and possibly significant CPU and memory overhead?

You may have some meme scripts that you found on the internet that do things way worse than sp_WhoIsActive, but if you want to see these goodies you’ll need to hit the dm_exec_query_statistics_xml DMF, which… your meme scripts probably don’t do.

Sorry about that.

But you can do this, which is relatively simple and easy even for the most steadfast meme script users:

EXEC sp_WhoIsActive 
    @get_plans = 1;

Now, when you look at the properties of the root plan operator, you should see a parameter list like this:

SQL Server Query Plan
it’s just you and me

Which has both the compile and run time values for any parameters your query was supplied. Keep in mind this won’t work with local variables, because they’re not parameters ;^}

Thanks for reading!

Going Further


If this is the kind of SQL Server stuff you love learning about, you’ll love my training. I’m offering a 75% discount to my blog readers if you click from here. I’m also available for consulting if you just don’t have time for that, and need to solve database performance problems quickly. You can also get a quick, low cost health check with no phone time required.

Tricky Situations When Rewriting Functions In SQL Server

Walk In Line


Far and away, some of the trickiest situations I run into when helping clients is rewriting scalar functions that have WHILE loops in them.

This sort of procedural code is often difficult, but not impossible, to replace with set-based logic.

Sure, lots of IF/THEN/ELSE stuff can be tough too, though that’s often easier to  manage with CASE expressions in stacked CTEs or derived tables.

I ran across a really interesting function recently that I had to rewrite that had a couple WHILE loops in it, and I’ve simplified the example here to show my approach to fixing it.

Table Face


The original intent of the function was to do some string manipulation and return a cleaned version of it.

There were several loops that looked for “illegal” characters, add in formatting characters (like dashes), etc.

The problem the function caused wasn’t it running for a long time (we’ll talk more about that tomorrow), it was that the function was called in really critical code paths that Function Repercussions© were messing with:

  • Row by row execution
  • Inhibited parallelism

These are not the kinds of functions that are Froid Friendly© either. If they were, I could largely leave them alone. Maybe.

Depends on bugs.

Bad Way


The bad way of doing this is like so. If you write functions like this, feel bad. Let it burn a little.

Ten years ago, I’d understand. These days, there’s a billion blog posts about why this is bad.

CREATE OR ALTER FUNCTION
    dbo.CountLetters_Bad
(
    @String varchar(20)
)
RETURNS bigint
AS 
BEGIN

DECLARE
    @CountLetters bigint = 0,
    @Counter int = 0;
    
    WHILE 
        LEN(@String) >= @Counter
    BEGIN
        IF PATINDEX
           (
               '%[^0-9]%', 
               SUBSTRING
               (
                   @String, 
                   LEN(@String) - @Counter, 
                   1
               )
           ) > 0
        BEGIN
            SET @CountLetters += 1;
            SET @Counter += 1;
        END;        
        ELSE        
        BEGIN
            SET @Counter += 1;
        END;
    END;

    RETURN @CountLetters;

END;
GO 


SELECT 
    CountLetters = 
        dbo.CountLetters_Bad('1A1A1A1A1A');

Better Way


This is a better way to write this specific function. It doesn’t come with all the baggage that the other function has.

But the thing is, if you just test them with the example calls at the end, you wouldn’t nearly be able to tell the difference.

CREATE OR ALTER FUNCTION 
   dbo.CountLetters
(   
    @String AS varchar(20)  
)  
RETURNS table
AS
RETURN

WITH
    t AS 
(
    SELECT TOP(LEN(@String))
        *,
        s = 
            SUBSTRING
            (
                @String, 
                n.Number +1, 
                1
            )
    FROM dbo.Numbers AS n
)
    SELECT
        NumLetters = 
            COUNT_BIG(*)
    FROM t
    WHERE PATINDEX('%[^0-9]%', t.s) > 0;
GO

SELECT
    cl.*
FROM dbo.CountLetters('1A1A1A1A1A') AS cl;

Pop Quiz Tomorrow


This is a problem I run into a lot: developers don’t really test SQL code in ways that are realistic to how it’ll be used.

  • Look, this scalar UDF runs fine for a single value
  • Look, this view runs fine on its own
  • Look, this table variable is great when I pass a test value to it

But this is hardly the methodology you should be using, because:

  • You’re gonna stick UDFs all over huge queries
  • You’re gonna join that view to 75,000 other views
  • You’re gonna let users pass real values to table variables that match lots of data

In tomorrow’s post, I’m gonna show you an example of how to better test code that calls functions, and what to look for.

Thanks for reading!

Going Further


If this is the kind of SQL Server stuff you love learning about, you’ll love my training. I’m offering a 75% discount to my blog readers if you click from here. I’m also available for consulting if you just don’t have time for that, and need to solve database performance problems quickly. You can also get a quick, low cost health check with no phone time required.

How NULLable Columns Can Cause Performance Issues In SQL Server

Invitational


Defining things scares people. Pause for a moment to think about how many scripts have been written where some roustabout has a mental breakdown when someone refers to them as a boyfriend or girlfriend.

Table definitions have a similar effect on developers. In today’s post, I’m going to use temp tables as an example, but the same thing can happen with regular tables, too.

The issue isn’t with NULL values themselves, of course. The table definition  we’re going to use will allow NULLs, but no NULLs will be present in the data.

The issue is with how you query NULLable columns, even when no NULLs are present.

Let’s take a look!

Insecure


Let’s create a temporary table that allows for NULLs, and fill it with all non-NULL values.

CREATE TABLE
    #comment_sil_vous_plait
(
    UserId int NULL
);

INSERT
    #comment_sil_vous_plait WITH(TABLOCK)
(
    UserId
)
SELECT
    c.UserId
FROM dbo.Comments AS c
WHERE c.UserId IS NOT NULL;

Unfortunately, this is insufficient for SQL Server’s optimizer down the line when we query the table.

But we need one more table to round things out.

Brilliant


This temporary table will give SQL Server’s optimizer all the confidence, temerity, and tenacity that it needs.

CREATE TABLE
    #post_sil_vous_plait
(
    OwnerUserId int NOT NULL
);

INSERT
    #post_sil_vous_plait WITH(TABLOCK)
(
    OwnerUserId
)
SELECT
    p.OwnerUserId
FROM dbo.Posts AS p
WHERE p.OwnerUserId IS NOT NULL;

Just three tiny letters. N-O-T.

That’s all it takes.

The Queries


If you’ve been hanging around SQL Server for long enough, you’re probably aware of what happens when you use NOT IN and encounter NULL values in your tables.

It says “nope” and gives you an empty result (or a NULL result!) because you can’t match values to NULLs that way.

SELECT
    c = COUNT_BIG(*)
FROM #post_sil_vous_plait AS psvp
WHERE psvp.OwnerUserId NOT IN 
      (
          SELECT 
             csvp.UserId 
         FROM #comment_sil_vous_plait AS csvp
      );


SELECT
    c = COUNT_BIG(*)
FROM #post_sil_vous_plait AS psvp
WHERE NOT EXISTS
      (
          SELECT 
             1/0
         FROM #comment_sil_vous_plait AS csvp
         WHERE csvp.UserId  = psvp.OwnerUserId
      );

But since we have no NULLs, well, we don’t have to worry about that.

But we do have to worry about all the stuff SQL Server has to do to see if any NULLs come up.

The Plans


For the NOT IN query, which runs about 4.5 seconds, there are two separate scans of the #comments table.

SQL Server Query Plan
yuck

Most of this query plan is expected. There’s a scan of #comments, a scan of #posts, and a hash join to bring them together.

But down below, there’s an additional branch with a row count spool, and a predicate applied to the scan looking for NULL values. The spool doesn’t return data, it’s just there to look for a NULL value and bail the query out if it finds one.

For the NOT EXISTS query, which finishes in 2.5 seconds, we have all the expected parts of the above query plan, but without the spool.

SQL Server Query Plan
flawless

You could partially solve performance issues in both queries by sticking a clustered index on both tables.

If you’re into that sort of thing (I am).

Thanks for reading!

Going Further


If this is the kind of SQL Server stuff you love learning about, you’ll love my training. I’m offering a 75% discount to my blog readers if you click from here. I’m also available for consulting if you just don’t have time for that, and need to solve database performance problems quickly. You can also get a quick, low cost health check with no phone time required.

Why You’re Testing SQL Server Code For Performance The Wrong Way

Turning And Turning


In yesterday’s post, I showed you a function rewrite from Scalar to Inline Table Valued, and gave you a couple example calls.

Now, if this is all you’re doing with a function, there’s absolutely no need to rewrite them.

SELECT
    cl.*
FROM dbo.CountLetters('1A1A1A1A1A') AS cl;

SELECT 
    CountLetters = 
        dbo.CountLetters_Bad('1A1A1A1A1A');

If you’re doing something like this, and maybe assigning it to a variable or using it to guide some branching logic, don’t you sweat it for one single solitary second.

You may want to make sure whatever code inside the function runs well, but changing the type of function here isn’t going to improve things.

More realistically, though, you’re going to be calling functions as part of a larger query.

Second To None


Let’s say you’re doing something a bit like this:

SELECT
    u.DisplayName,
    TotalScore = 
        SUM(p.Score * 1.),
    Thing = 
        dbo.CountLetters_Bad(u.DisplayName)
FROM dbo.Users AS u
JOIN dbo.Posts AS p
    ON p.OwnerUserId = u.Id
WHERE EXISTS
(
    SELECT
        1/0
    FROM dbo.Votes AS v
    WHERE p.Id = v.PostId
)
AND u.Reputation >= 100000
GROUP BY 
    u.DisplayName
ORDER BY
    TotalScore DESC;

It’s a far different scenario than just assigning the output of a Scalar UDF to a variable or using it to guide some branching logic.

Brooklyn Zoo


A few minor syntax changes to the function and to how the query calls it can make a big difference.

SELECT
    u.DisplayName,
    TotalScore = 
        SUM(p.Score * 1.),
    Thing = 
        (SELECT * FROM dbo.CountLetters(u.DisplayName))
FROM dbo.Users AS u
JOIN dbo.Posts AS p
    ON p.OwnerUserId = u.Id
WHERE EXISTS
(
    SELECT
        1/0
    FROM dbo.Votes AS v
    WHERE p.Id = v.PostId
)
AND u.Reputation >= 100000
GROUP BY 
    u.DisplayName
ORDER BY
    TotalScore DESC;

Since this is a table valued function, you have to ask for results from it like you’d ask for results from a table.

HD Video


Whether you like competitive sports, good vs. evil, Great British Bake Off, or watching election results, you can appreciate the magnificence of a Flawless Victory©.

As long as someone wins who you’re rooting for. But here, no one’s rooting for scalar functions. They’re just unlovable.

I’m going to show you the very end of these plans to see the timing differences.

SQL Server Query Plan
1945

The Scalar UDF plan takes ~23 seconds, and the inline TVF plan takes 7.5 seconds.

And this is why testing certain linguistic elements in SQL needs to be done realistically. Just testing a single value would never reveal performance issues.

Thanks for reading!

Going Further


If this is the kind of SQL Server stuff you love learning about, you’ll love my training. I’m offering a 75% discount to my blog readers if you click from here. I’m also available for consulting if you just don’t have time for that, and need to solve database performance problems quickly. You can also get a quick, low cost health check with no phone time required.

What To Do When Your Query Runs For Too Long To Get An Actual Execution Plan

Willfully


While I do enjoy answering questions about SQL Server performance, it can be frustrating trying to get the right set of information.

One thing that comes up pretty often when you ask for an actual execution plan, is that the query “never finishes” and one can’t be captured.

Good news! There are ways for you to get execution plans in progress with some of the actual query plan elements inside.

You don’t have to let the query run to completion, but generally if you give it a few minutes you can capture where things are going wrong.

Longer is usually better, but I understand that some queries are real crushers, and cause big server problems.

Option None: Live Query Plans


The problem with Live Query Plans is that they’re really unreliable. Many times I’ve tried to use them and the Live Plan never shows up, and worse I’ll be unable to close the SSMS tab without killing the process in Task Manager.

When it does work, it can be sort of confusing. Here’s a completed query with Live Plans enabled:

SQL Server Query Plans
nope.

It took about 49 seconds, but… What took 49 seconds? Repartition Streams? Clustered Index Scan? Something else?

Here’s another really confusing one:

SQL Server Query Plan
means of deduction

Apparently everything took three minutes and thirty six seconds.

Good to know.

Screw these things.

Option One: Get Plans + sp_WhoIsActive


Good ol’ sp_WhoIsActive will check to see if you have the right bits and views in your SQL Server, and return in-progress actual plans to you.

To do that, it looks at dm_exec_query_statistics_xml. That’s SQL Server 2016 and up, for those of you playing along at home. Hopefully you have it installed at home, because you sure don’t at work.

But anyway, if you enable either Actual Execution plans, OR Live Query Plans, and then run sp_WhoIsActive in another window, you’ll get much more sensible plans back. Usually.

SQL Server Query Plan
udderly

This accurately shows where time is spent in the query, which is largely in the scan of the Posts table.

Where There’s Still A Prioblem


Where things fall apart is still when a spool is built. If you can follow along a bit…

SQL Server Query Plan
not even almost
  • The top query plan shows time accurately distributed amongst operators, from the Actual Plan run to completion
  • The bottom query plan shows time quite inaccurately, getting the plan from dm_exec_query_statistics_xml after the query had been running for three minutes

I guess the bottom line is if you see an Eager Index Spool in your query plan, you should fix that before asking any questions.

Thanks for reading!

Going Further


If this is the kind of SQL Server stuff you love learning about, you’ll love my training. I’m offering a 75% discount to my blog readers if you click from here. I’m also available for consulting if you just don’t have time for that, and need to solve database performance problems quickly. You can also get a quick, low cost health check with no phone time required.

SQL Server Management Studio Should Add Filters When You Get Execution Plans

Have You Heard The One…


Whenever I’m tuning a long stored procedure, I use sp_HumanEvents to grab query plans and other details about what’s going on.

The thing is… It should be a lot easier than that. Unfortunately, when you tell SSMS that you want to get actual execution plans, it gives you absolutely everything.

For code that loops or has a lot of tiny queries that run leading up to more painful queries. All that is a slog, and can result in SSMS becoming unresponsive or crashing.

It’s be really cool if hitting the Actual Execution Plan button filter out some stuff so you’re not collecting everything.

It could even use the same GUI style as Extended Events.

SQL Server Extended Events
in england

Granted, not all the ones pictured here would make sense, but metrics like CPU and duration would be helpful to keep noisy query plans out of the picture.

Thanks for reading!

Going Further


If this is the kind of SQL Server stuff you love learning about, you’ll love my training. I’m offering a 75% discount to my blog readers if you click from here. I’m also available for consulting if you just don’t have time for that, and need to solve database performance problems quickly. You can also get a quick, low cost health check with no phone time required.

How Microsoft Could Make Problems In Execution Plans Easier To Understand

Round Up


Execution plans have come a long way over the years, gradually adding more and more details as computing power becomes less of a hurdle to collecting metrics.

The thing is, it’s not always obvious where to look or dig deeper into a query plan to figure out where problems are.

Right now, there are some warnings:

  • At the root operator for a few different things
  • For memory consuming operators when they spill

But there are some other things in query plans that should be loud and clear, because they’re not going to be obvious to folks just getting started out reading query plans.

Non-SARGable Predicates:

These can cause a lot of issues:

  • Unnecessary scans
  • Poor cardinality estimates

It’s primarily caused by:

  • function(column) = something
  • column + column = something
  • column + value = something
  • value + column = something
  • column = @something or @something IS NULL
  • column like ‘%something’
  • column = case when …
  • value = case when column…
  • Mismatching data types (implicit conversion)

The thing is, it’s hard to see where this stuff happens in a plan, unless the plan is very small, or you’re looking directly at the query text, which is often truncated when pulled from a query plan. It would be nice if we got a warning of some sort on operators where this happened.

Predicates That Result In Scans

If you write a where clause, but don’t have an index with a key that matches that where clause, sometimes you’ll get a missing index request and sometimes you won’t. It’s a bit of a gamble of course.

For large tables, this can be painful, burn a lot of CPU, and result in a parallel plan where you could get by without one if you had a better index in place.

SQL Server Query Plan
bigscan4u

Of course, not every scan has a predicate: think joins without a where clause, or where only one table has a predicate against it. You don’t have much choice but to scan an index.

Eager Index Spools

Sometimes SQL Server wants an index so badly that it creates one on its own for you. When this happens on a large enough table, you can spend an awful lot of time waiting for it.

You know like when you put something in the microwave and you’re standing there staring at the timer and even though you set it for two minutes it seems to hang out at 1:30 forever? That’s what an Eager Index Spool is like. A Hungry Man Dinner that you microwave for an hour but still comes out with ice around the edges of your Salisbury Steak.

SQL Server Query Plan
community

Okay, I stretched that one a bit. But here’s the thing: If SQL Server is gonna spend all that time creating a temporary index for you, it should tell you. Maybe a missing index request, maybe a warning on the spool itself. Just… anything that would help alert more casual execution plan observers to the fact that an index might not be the worst idea, here.

Why Indexes Weren’t Used

I know you. You create indexes all the time, then for some strange reason your queries don’t use them, or stop using them.

When SQL Server optimizes a query, part of the flow chart is a pit stop called index matching. At this point, SQL Server looks at available indexes and then chooses to use or not use them based on various pieces of feedback.

Sometimes it’s obvious why an index wasn’t used, like if it only covers a portion of the query, or if the key columns weren’t in the best order. Other times, it’s really unclear.

It would be nice if we had reasons for that available, even if it’s only in actual plans.

Louder Warnings For Deeper Problems

Right now, SQL Server buries some information that can be really important to why a query didn’t perform well:

  • When estimated and actual rows or executions are way off
  • When something forces a query to run serially
  • When operators execute more than once (including rebinds and rewinds)
  • When rows are badly skewed across parallel threads

The thing is, like a lot of these other items on this list, it takes real digging to figure out if any of them apply to you, and if they’re why your query slowed down. They just need some basic visual indicators to draw attention to them at the right times.

Different Per-Operator Details

When you look at each individual operator in an actual execution plan, you get sort of a confusing story:

  • Estimated cost
  • Wall clock time
  • Actual rows
  • Estimated rows
  • Percent of actual to estimated rows

I’d throw out some of that, and show:

  • CPU time
  • Wall clock time
  • Actual Rows
  • Actual Executions
  • Percent of actual to estimated

It would also be nice to have per-operator wait stats at this juncture, since we’d need to know why there’s a discrepancy between CPU and wall clock time, e.g. because of blocking or waiting on some other resource.

While we’re talking about all this, it might be helpful to consider the direction plans show their work. Right to left for data and left to right for logic are… fine. I guess. But up and down might make more sense. A lot of folks I know have a tough time understanding when things happen in horizontal execution plans, where vertical plans would be far more clear.

Thanks for reading!

Going Further


If this is the kind of SQL Server stuff you love learning about, you’ll love my training. I’m offering a 75% discount to my blog readers if you click from here. I’m also available for consulting if you just don’t have time for that, and need to solve database performance problems quickly. You can also get a quick, low cost health check with no phone time required.