When Query Spills Cause tempdb Contention And Performance Issues In SQL Server

Temptables


I was helping a client troubleshoot a scalability issue recently, where during one point in their workload tempdb went out of control.

What was puzzling them was that nothing in the stored procedure did anything with temporary objects, cursors, or any of the other obvious things that go to el baño público. And the query plan itself was a pretty simple little loopy thing.

It wasn’t until I grabbed a quick sample of actual execution plans with Extended Events that the problem became more obvious.

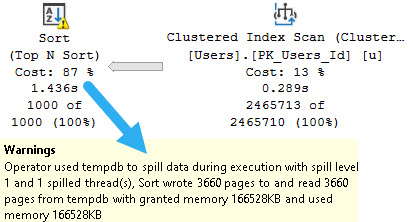
Despite the fact that the query was only passing around 7 rows, we were getting a one row estimate, and there was a spilling Sort operator.

Chance Of Cloudballs


There were a couple compounding issues here, of course, like that their database is hosted in the cloud.

It doesn’t matter which cloud you talk about, this is a problem they all have and I see people face constantly.

I/O sucks, up there.

It was a lot harder to get this to repro on my local hardware, because I have very nice drives.

Let’s take a look!

Bleak


If I run this query, it’ll spill a little bit. I have the MAXDOP 1 hint on there to artificially slow it down. Without that, the fast query and I/O make the contention harder to hit.

SELECT TOP (1000) 
    u.Id 
FROM dbo.Users AS u
ORDER BY u.Reputation
OPTION(MAXDOP 1);
SQL Server Query Plan
just like me

I stuck it in a stored procedure to make calling it from ostress a little bit easier.

No Return


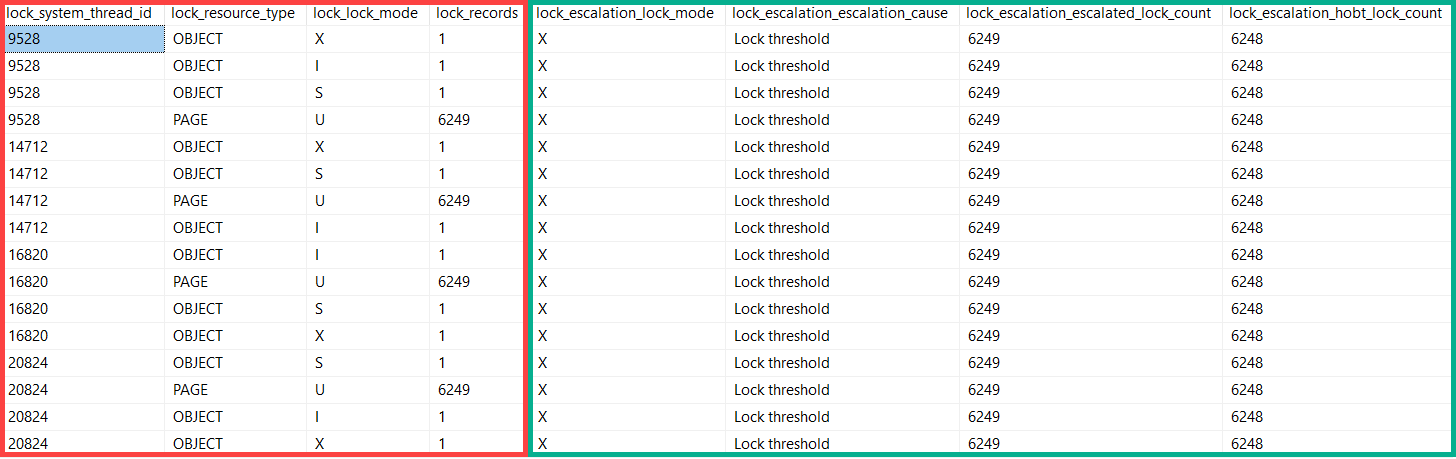
After running for a bit, eventually we hit GAM contention:

SQL Server tempdb Contention
tuesday

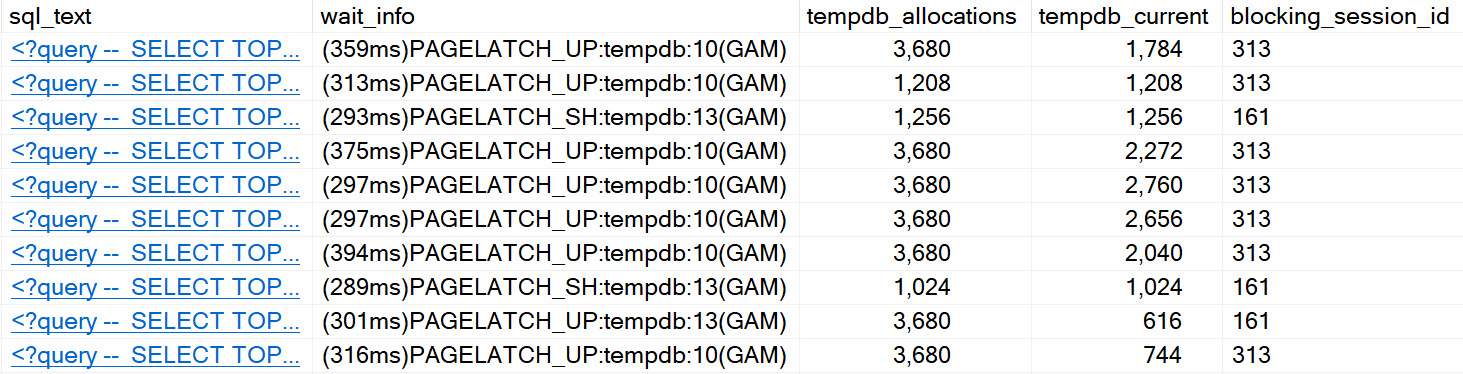
We can see all the classic signs of tempdb contention, arising from spills.

It’s worth noting that enabling in-memory tempdb seems to alleviate this issue for the most part. I’d show you a picture of that, but it’s not worth 1000 words.

Fixing The Spill


Normally, I wouldn’t bother fixing a spill of that size, but in this case it was worthwhile because it was harming concurrency.

The quick fix was to add a MIN_GRANT_PERCENT hint. The long-term fix is to add an index to support the Sort operation.

Good ol’ indexes, putting data in order.

There are many reasons why a spill may occur. Poor estimates are quite common, but the reason for that poor estimate has about a billion potential root causes.

Even if your query gets enough memory, sometimes you may still see spills because certain operators had to share memory.

It’s a wild world.

Thanks for reading!

Going Further


If this is the kind of SQL Server stuff you love learning about, you’ll love my training. I’m offering a 75% discount to my blog readers if you click from here. I’m also available for consulting if you just don’t have time for that and need to solve performance problems quickly.

The Forced Parameterization Extended Events That Don’t Work In SQL Server

Busted Up


There are a couple Extended Events that I was really excited about adding to sp_HumanEvents, but try as I might they wouldn’t fire off anything. Ever.

Why was I excited? Because they would tell us why forced parameterization wasn’t used.

SQL Server Extended Events
cool! great. wait, no.

The thing is, they only work if you know someone who isn’t Australian and they know how to change memory bits in WinDbg.

So like. Don’t bother with them for now.

Thanks for reading!

Going Further


If this is the kind of SQL Server stuff you love learning about, you’ll love my training. I’m offering a 75% discount to my blog readers if you click from here. I’m also available for consulting if you just don’t have time for that and need to solve performance problems quickly.

Check Out My Presentation: Better Troubleshooting With sp_HumanEvents

Group Me Baby


Going Further


If this is the kind of SQL Server stuff you love learning about, you’ll love my training. I’m offering a 75% discount to my blog readers if you click from here. I’m also available for consulting if you just don’t have time for that and need to solve performance problems quickly.

sp_HumanEvents: Tracking Blocking, Compiles, and Recompiles

First Day Angry


sp_HumanEvents

Going Further


If this is the kind of SQL Server stuff you love learning about, you’ll love my training. I’m offering a 75% discount to my blog readers if you click from here. I’m also available for consulting if you just don’t have time for that and need to solve performance problems quickly.

Lock Promotion In SQL Server Parallel Query Plans

I Don’t Always Talk About Locks


But when I do, it’s usually to tell people they should use RCSI, and then disappear in a cloud of smoke.

Recently I was thinking about lock promotion, because that’s what happens when I get lonely.

While digging around, I found some interesting stuff.

This is the part where I share it with you.

Without Five I Couldn’t Count To Six


The first thing I wanted was a table that I wouldn’t care about messing up, so I made a copy of the Users table.

SELECT *
INTO dbo.IDontCareAboutUsers
FROM dbo.Users AS u

ALTER TABLE dbo.IDontCareAboutUsers 
    ADD CONSTRAINT pk_IDontCareAboutUsers_id PRIMARY KEY CLUSTERED (Id);

Then I picked on a Reputation that only has one entry in the table: 20720.

BEGIN TRAN
UPDATE idcau
SET idcau.Reputation = 0
FROM dbo.IDontCareAboutUsers AS idcau
WHERE idcau.Reputation = 20720
OPTION(MAXDOP 4)

ROLLBACK

What followed was a full morning of wishing I paid more attention in internals class.

Number One


The first thing I found is that there were 16 attempts at promotion, and four successful promotions.

SQL Server query results in SQL Server Management Studio
4×4

Why did this seem weird? I dunno.

Why would there be only 4 successful attempts with no competing locks from other queries?

Why wouldn’t all 16 get promotions?

Number Two


Well, that’s a parallel plan. It’s running at DOP 4.

I added the hint in the update query above so I wouldn’t have to, like, do more to prove it.

A SQL Server Query Plan
Plantar

Okay, maybe this makes a little more sense. Four threads.

If each one tried four times, maybe another thread was like “nah, yo”, and then got by on the fifth try.

Number Three


Looking at perfmon counters before and after running showed.. exactly four!

SQL Server Perfmon Counters
Divisible
SQL Server Perfmon Counters
Still nowhere to go

Number Four


sp_WhoIsActive only showed single locks

SQL Server sp_WhoIsActive Locks
Hrm.

This isn’t wrong, necessarily. This is how things look in the DMVs it touches after the update runs, but the transaction is still open.

I’m not mad, but I am curious. I wanna know what happened in the middle.

Number Five


I set up a couple Extended Event sessions, one to capture locks acquired, and one to capture lock escalations.

This was neat.

SQL Server Extended Events Locks
Tell’em, picture

The red rectangle comes from locks acquired during the course of the update. You can see four separate threads going through and grabbing locks.

Each thread got the okay to escalate at 6,249 page locks.

Number Six


Lock promotion isn’t only denied when competing locks on the table are held by other queries.

Modification queries taking locks will attempt promotion every 1,250 locks.

Documentation regarding lock promotion points to at least 5,000 locks needing to be held before it occurs, as one factor (incompatible locks not being present are another).

If we have four threads asking every 1,250 locks (in this case on pages), they all will have made four attempts before finally escalating at 6,249.

6,249 / 1,250 is right around 5, for those who don’t have a calculator installed.

Don’t freak out if your monitoring tool tells you there’s a lot of attempts at escalation, and very few are successful.

It’s not always a sign that there’s blocking, though you may be able to correlate that with lock waits if both are present.

Thanks for reading!

Going Further


If this is the kind of SQL Server stuff you love learning about, you’ll love my training. I’m offering a 75% discount to my blog readers if you click from here. I’m also available for consulting if you just don’t have time for that and need to solve performance problems quickly.

Hash Bailout With SQL Server Batch Mode Operations

Filler


This is a short post to “document” something interesting I noticed about… It’s kind of a mouthful.

See, hash joins will bail out when they spill to disk enough. What they bail to is something akin to Nested Loops (the hashing function stops running and partitioning things).

This usually happens when there are lots of duplicates involved in a join that makes continuing to partition values ineffective.

It’s a pretty atypical situation, and I really had to push (read: hint the crap out of) a query in order to get it to happen.

I also had to join on some pretty dumb columns.

Dupe-A-Dupe


Here’s a regular row store query. Bad idea hints and joins galore.

SELECT *
FROM dbo.Posts AS p
LEFT JOIN dbo.Votes AS v
ON  p.PostTypeId = v.VoteTypeId
WHERE ISNULL(v.UserId, v.VoteTypeId) IS NULL
OPTION (
       HASH JOIN, -- If I don't force this, the optimizer chooses Sort Merge. Smart!
       USE HINT('ENABLE_PARALLEL_PLAN_PREFERENCE'),
       MAX_GRANT_PERCENT = 0.0
       );

As it runs, the duplicate-filled columns being forced to hash join with a tiny memory grant cause a bunch of problems.

SQL Server extended events
Up a creek

This behavior is sort of documented, at least.

The value is a constant, hard coded in the product, and its value is five (5). This means that before the hash scan operator resorts to a sort based algorithm for any given subpartition that doesn’t fit into the granted memory from the workspace, five previous attempts to subdivide the original partition into smaller partitions must have happened.

At runtime, whenever a hash iterator must recursively subdivide a partition because the original one doesn’t fit into memory the recursion level counter for that partition is incremented by one. If anyone is subscribed to receive the Hash Warning event class, the first partition that has to recursively execute to such level of depth produces a Hash Warning event (with EventSubClass equals 1 = Bailout) indicating in the Integer Data column what is that level that has been reached. But if any other partition later also reaches any level of recursion that has already been reached by other partition, the event is not produced again.

It’s also worth mentioning that given the way the event reporting code is written, when a bail-out occurs, not only the Hash Warning event class with EventSubClass set to 1 (Bailout) is reported but, immediately after that, another Hash Warning event is reported with EventSubClass set to 0 (Recursion) and Integer Data reporting one level deeper (six).

But It’s Different With Batch Mode


If I get batch mode involved, that changes.

CREATE TABLE #hijinks (i INT NOT NULL, INDEX h CLUSTERED COLUMNSTORE);

SELECT *
FROM dbo.Posts AS p
LEFT JOIN dbo.Votes AS v
ON  p.PostTypeId = v.VoteTypeId
LEFT JOIN #hijinks AS h ON 1 = 0
WHERE ISNULL(v.UserId, v.VoteTypeId) IS NULL
OPTION (
       HASH JOIN, -- If I don't force this, the optimizer chooses Sort Merge. Smart!
       USE HINT('ENABLE_PARALLEL_PLAN_PREFERENCE'),
       MAX_GRANT_PERCENT = 0.0
       );

The plan yields several batch mode operations, but now we start bailing out after three recursions.

SQL Server extended events
Creeky

I’m not sure why, and I’ve never seen it mentioned anywhere else.

My only guess is that the threshold is lower because column store and batch mode are a bit more memory hungry than their row store counterparts.

Thanks for reading!

Going Further


If this is the kind of SQL Server stuff you love learning about, you’ll love my training. I’m offering a 75% discount to my blog readers if you click from here. I’m also available for consulting if you just don’t have time for that and need to solve performance problems quickly.