Why Some Types of Parallel Scans can be Slow on Cloud Storage

Upon reading the title, you may be thinking that of course parallel scans will be slow in the cloud. Cloud storage storage simply isn’t very fast. I would argue that there’s a bit more to it.

The Timeout

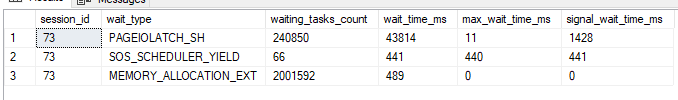
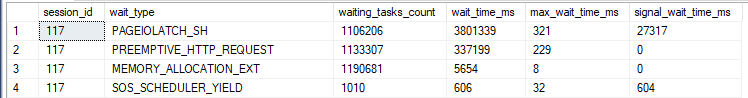
A query timed out the other day in production after running for 600 seconds. Of note, one of the tables used by the stored procedure is in a database with data files hosted by Azure blob storage. I grabbed the wait stats for the timed out query using query store:

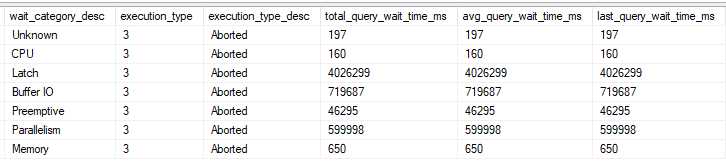
According to the documentation, the latch category maps to LATCH_% wait types and the preemptive category maps to PREEMPTIVE_% wait types. I wasn’t able to reproduce the timeout when executing the same query text, even if I forced the exact same query plan with a USE PLAN. Admittedly, I was puzzled by the wait stats distribution for a while.

Decoding the Categories

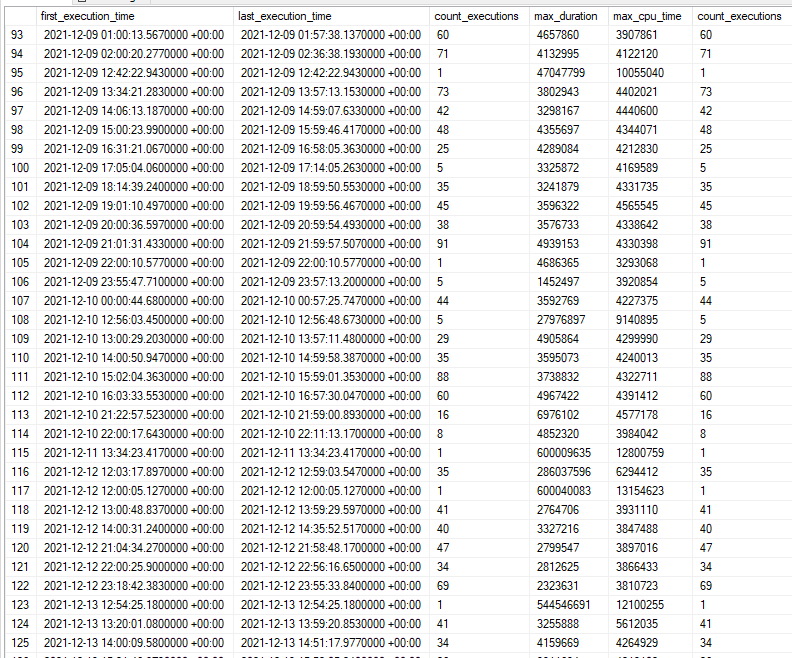
I eventually realized that typically the first execution of the stored procedure for the business day tended to be the slowest. Sorting query store runtime DMV results by time:

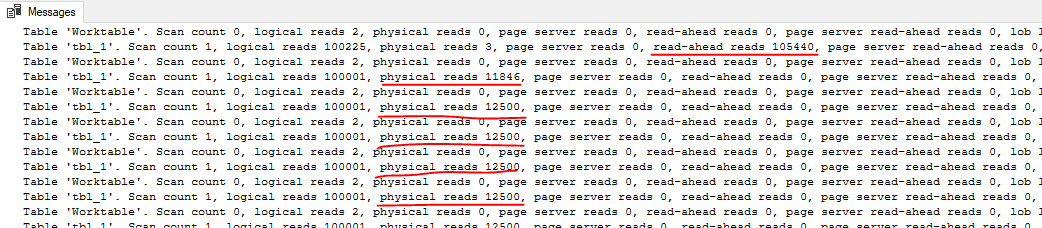
I also noticed that the timed out executions tended to have higher physical I/O than the other executions. Sorting query store runtime DMV results by I/O:

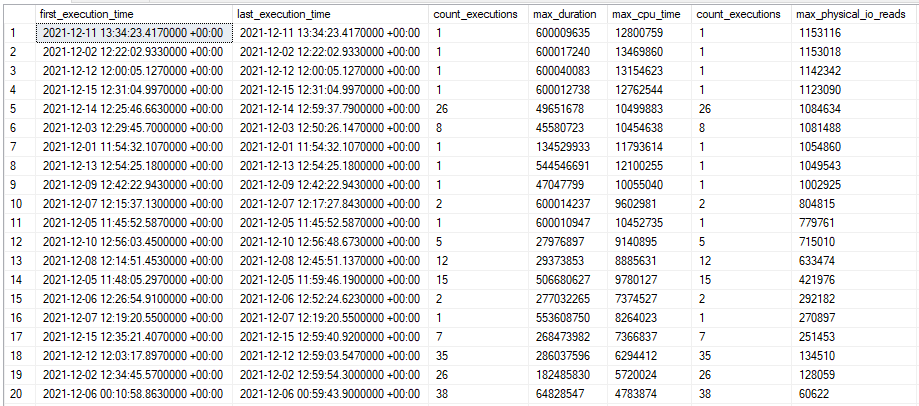
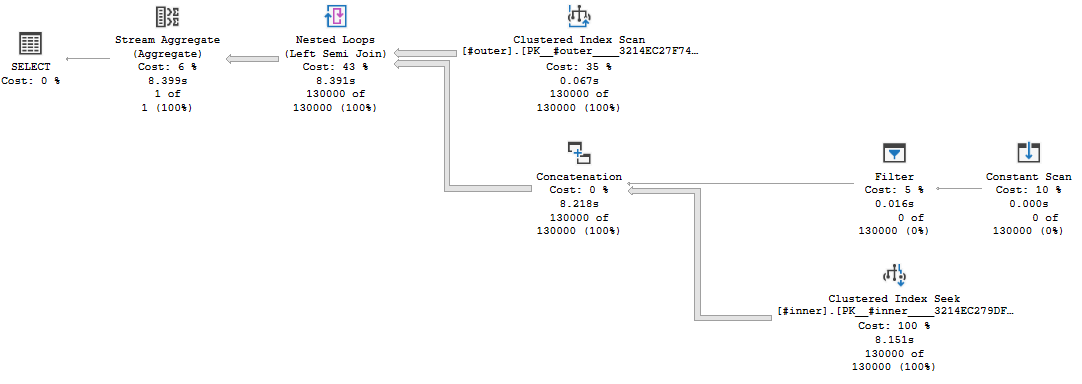
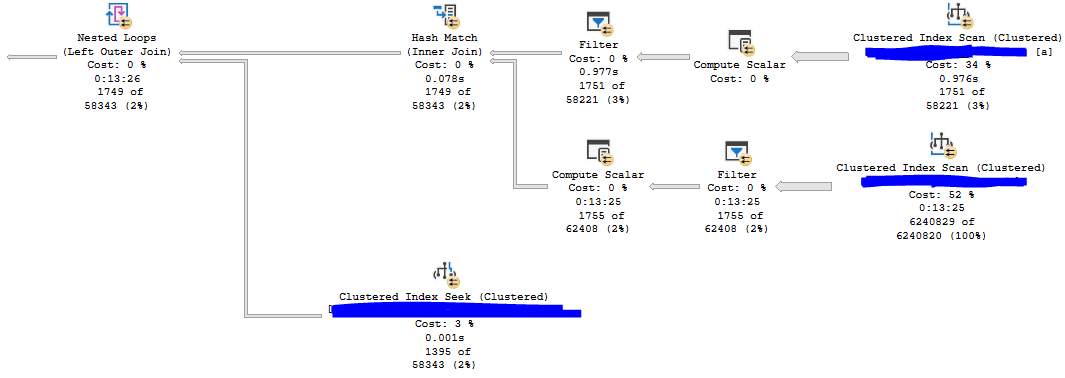
I now finally had a method to reproduce the poor performance of the stored procedure: being the first one to run the code in the morning, presumably when the buffer pool didn’t have anything helpful for this stored procedure. Early in the morning, I was able to capture an actual plan that took 13 minutes at MAXDOP 8. Nearly all of the execution time is spent on an index scan for a table that is hosted on cloud storage:

Here are the top wait stats from the actual plan:

<Wait WaitType=”LATCH_EX” WaitTimeMs=”5423928″ WaitCount=”1971″ />
<Wait WaitType=”PAGEIOLATCH_SH” WaitTimeMs=”977288″ WaitCount=”29210″ />
<Wait WaitType=”CXPACKET” WaitTimeMs=”809678″ WaitCount=”700″ />
<Wait WaitType=”PREEMPTIVE_HTTP_REQUEST” WaitTimeMs=”43801″ WaitCount=”50344″ />

I used the task DMVs during query execution to get information about the latch type:


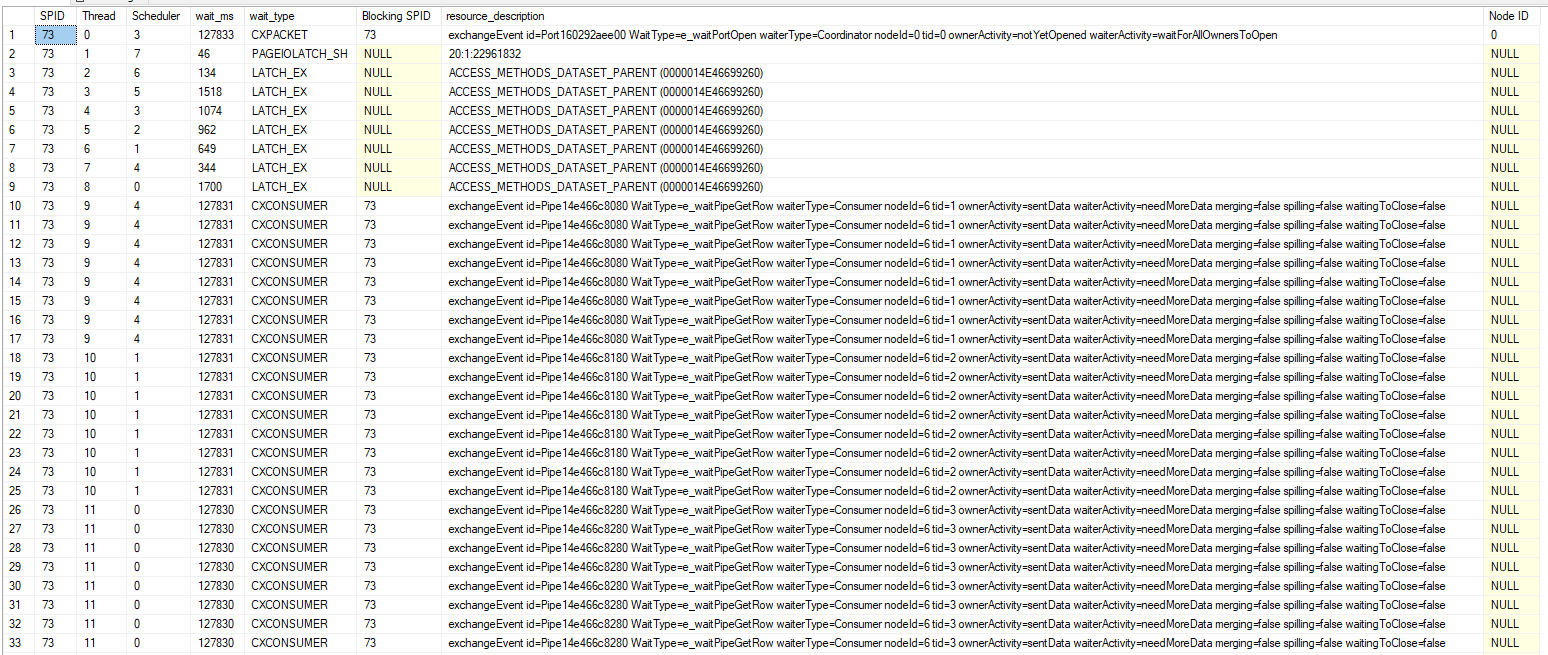
Now I know that the query spends most of its time trying to acquire exclusive latches of the ACCESS_METHODS_DATASET_PARENT type. There is also a fair amount of I/O wait time compared to the mysterious PREEMPTIVE_HTTP_REQUEST wait type.

The ACCESS_METHODS_DATASET_PARENT Latch

I asked the community if this latch was considered to be interesting. The winning option was “What?”. As usual, twitter is useless:

For my query, at times I observed seven out of eight worker threads all waiting for an exclusive latch at the same time. This isn’t surprising considering that the query averaged 6.7 LATCH_EX wait seconds per second. That the other thread was doing an I/O wait while the others were waiting for the latch, so perhaps the worker threads were doing I/Os while holding the latch resource. On a development environment (with unfortunately significantly better I/O), I mocked up a roughly similar table and enabled the latch_acquired, latch_released, file_read, and file_read_completed extended events. The results were quite educational:

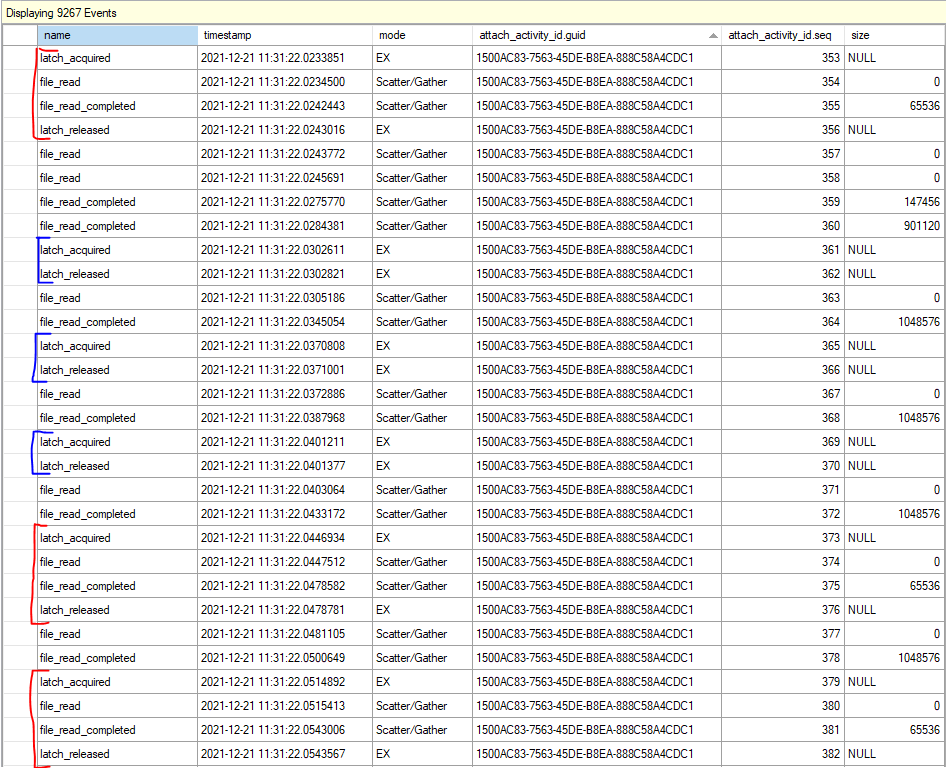
There were two different patterns in the XE files. Sometimes the worker threads would acquire the latch, perform one or more I/Os, and release the latch. Otherwise they would acquire the latch and quickly release it without performing any I/Os. Paul Randal recently wrote the following about this latch:

When either a heap or an index is being accessed, internally there’s an object called a HeapDataSetSession or IndexDataSetSession, respectively. When a parallel scan is being performed, the threads doing the actual work of the scan each have a “child” dataset (another instance of the two objects I just described), and the main dataset, which is really controlling the scan, is called the “parent.”

When one of the scan worker threads has exhausted the set of rows it’s supposed to scan, it needs to get a new range by accessing the parent dataset, which means acquiring the ACCESS_METHODS_DATASET_PARENT latch in exclusive mode. While this can seem like a bottleneck, it’s not really, and there’s nothing you can do to stop the threads performing a parallel scan from occasionally showing a LATCH_EX wait for this latch.

At a very high level, I suspect that the fast latch releases (marked in blue in the above picture) occur when the worker thread can acquire an already available range of rows from the parent object. The slow latch releases (marked in red) occur when the worker thread tries to acquire a new range, can’t find one, and has to perform I/Os to add more ranges to the parent object. In both cases the parent object needs to be modified, so an exclusive latch is always taken. I don’t know how it actually works behind the scenes, but the theory matches the observed behavior.

In summary, the query does a parallel scan which is protected by the ACCESS_METHODS_DATASET_PARENT latch. The table getting scanned is hosted on cloud storage with high I/O latency. Latency being high contributes to the exclusive latch on ACCESS_METHODS_DATASET_PARENT getting held for a long time which can block all of the other parallel worker threads from proceeding.

The PREEMPTIVE_HTTP_REQUEST Wait Type

I already have enough information to be confident in a query tuning fix for the stored procedure, but for completeness, I also investigated the PREEMPTIVE_HTTP_REQUEST wait type. I was not able to find any useful documentation for this wait type. The official documentation only says “Internal use only.” Thanks, Microsoft.

A common technique to learn more about undocumented waits is to get callstacks associated with the wait type. I’ve seen the PREEMPTIVE_HTTP_REQUEST wait occur in Azure SQL databases, Azure SQL Managed Instances, and for databases hosted in Azure blob storage. It is possible to get callstacks for managed instances, but it is not possible to translate them because Microsoft does not release public symbols for managed instances. However, the blob storage scenario did allow me to get and translate call stacks for the wait. Below are a few of the stacks that I captured:

Performing I/Os to read data not in the buffer pool:

sqldk!XeSosPkg::wait_info_external::Publish
sqldk!SOS_Task::PushWait
sqlmin!SOS_Task::AutoSwitchPreemptive::AutoSwitchPreemptive
sqlmin!BlobAccess::AsyncHttpIOInternal
sqlmin!BlobAccess::AsyncIOInternal
sqlmin!XFCB2::ScatterReadInternal
sqlmin!FCB::ScatterRead
sqlmin!RecoveryUnit::ScatterRead
sqlmin!BPool::GetFromDisk
sqlmin!BPool::Get
sqlmin!BlobBase::FixNode
sqlmin!BlobManager::LocateBlob
sqlmin!BlobManager::OpenInternal
sqlmin!BlobManager::Open
sqlmin!LockBytesSS::Open
sqlmin!OpenLockBytesNew
sqlmin!OpenIlbssWithSeLobHandleRO
sqlmin!IndexDataSetSession::OpenStreamWithSeLobHandle
sqlmin!RowsetNewSS::OpenWithSeLobHandle
sqlmin!CBlobHandleBaseTableFactory::PilbGet
sqlTsEs!CompareLegacyLobNull
sqlTsEs!CTEsCompare<35,35>::BlCompareXcArgArgImpl
sqlTsEs!CEsExec::GeneralEval4
sqlmin!CQScanStreamAggregateNew::GetRowHelper

Writing LOB data to disk:

sqldk!XeSosPkg::wait_info_external::Publish
sqldk!SOS_Task::PushWait
sqlmin!SOS_Task::AutoSwitchPreemptive::AutoSwitchPreemptive
sqlmin!BlobAccess::AsyncHttpIOInternal
sqlmin!BlobAccess::AsyncIOInternal
sqlmin!XFCB2::ScatterReadInternal
sqlmin!FCB::ScatterRead
sqlmin!RecoveryUnit::ScatterRead
sqlmin!BPool::GetFromDisk
sqlmin!BPool::Get
sqlmin!BlobBase::FixNode
sqlmin!Blob::RWBlob
sqlmin!Blob::RWBlob
sqlmin!Blob::ReadWriteAt
sqlmin!BlobManager::ReadAtInternal
sqlmin!BlobManager::ReadAt
sqlmin!LockBytesSS::ReadAt
sqllang!write_LOB_chunked
sqllang!`anonymous namespace’::TSendRowClassNoCount<7,0>::TSendUnlimitedVartype<0>
sqllang!CTds74::SendRowImpl
sqlTsEs!CEsExec::GeneralEval
sqllang!CXStmtQuery::ErsqExecuteQuery
sqllang!CXStmtSelect::XretExecute
sqllang!CMsqlExecContext::ExecuteStmts<1,1>

Transaction log writes:

sqldk!XeSosPkg::wait_info_external::Publish
sqldk!SOS_Scheduler::UpdateWaitTimeStats
sqldk!SOS_Task::PopWait
sqlmin!SOS_ExternalAutoWait::~SOS_ExternalAutoWait
sqlmin!SOS_Task::AutoSwitchPreemptive::~AutoSwitchPreemptive
sqlmin!BlobAccess::AsyncHttpIOInternal
sqlmin!BlobAccess::AsyncIOInternal
sqlmin!XFCB2::AsyncWriteInternal
sqlmin!FCB::AsyncWrite
sqlmin!SQLServerLogMgr::FlushLCOld
sqlmin!SQLServerLogMgr::LogWriter
sqldk!SOS_Task::Param::Execute
sqldk!SOS_Scheduler::RunTask
sqldk!SOS_Scheduler::ProcessTasks
sqldk!SchedulerManager::WorkerEntryPoint
sqldk!SystemThreadDispatcher::ProcessWorker
sqldk!SchedulerManager::ThreadEntryPoint
KERNEL32.DLL+0x0000000000017974
ntdll.dll+0x000000000006A271

I’m guessing this one is renewing the lease as noted in the documentation: “the implementation of SQL Server Data Files in Azure Storage feature requires a renewal of blob lease every 45 to 60 seconds implicitly”

sqldk!XeSosPkg::wait_info_external::Publish
sqldk!SOS_Task::PushWait
sqlmin!SOS_Task::AutoSwitchPreemptive::AutoSwitchPreemptive
sqlmin!BlobAccess::AsyncHttpIOInternal
sqlmin!BlobAccess::AsyncIOInternal
sqlmin!LeaseRenewalManager2::RenewLeases
sqlmin!XStoreLeaseRenewalTask2
sqldk!SOS_Task::Param::Execute
sqldk!SOS_Scheduler::RunTask
sqldk!SOS_Scheduler::ProcessTasks
sqldk!SchedulerManager::WorkerEntryPoint
sqldk!SystemThreadDispatcher::ProcessWorker
sqldk!SchedulerManager::ThreadEntryPoint

Not surprisingly, all of them have to do with accessing azure storage. I was able to observe an interesting pattern during a table scan: every PAGEIOLATCH_SH wait was immediately preceded by a PREEMPTIVE_HTTP_REQUEST wait.

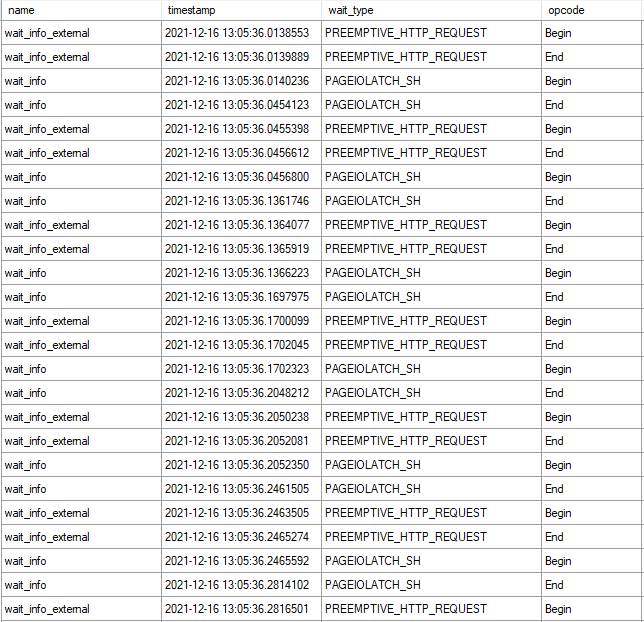
Getting stacks for the waits that are close together, with shared code removed and the I/O wait on top with the preemptive wait on the bottom:

sqldk!XeSosPkg::wait_info::Publish
sqldk!SOS_Task::PreWait
sqldk!WaitableBase::Wait
sqlmin!LatchBase::Suspend
sqlmin!LatchBase::AcquireInternal
sqlmin!BUF::AcquireLatch
sqlmin!BPool::Get
<<SHARED STACKS REMOVED>>

sqldk!XeSosPkg::wait_info_external::Publish
sqldk!SOS_Task::PushWait
sqlmin!SOS_Task::AutoSwitchPreemptive::AutoSwitchPreemptive
sqlmin!BlobAccess::AsyncHttpIOInternal
sqlmin!BlobAccess::AsyncIOInternal
sqlmin!XFCB2::ScatterReadInternal
sqlmin!FCB::ScatterRead
sqlmin!RecoveryUnit::ScatterRead
sqlmin!BPool::GetFromDisk
sqlmin!BPool::Get
sqlmin!BlobBase::FixNode
sqlmin!BlobManager::LocateBlob
sqlmin!BlobManager::OpenInternal
sqlmin!BlobManager::Open
sqlmin!LockBytesSS::Open
sqlmin!OpenLockBytesNew
sqlmin!OpenIlbssWithSeLobHandleRO
sqlmin!IndexDataSetSession::OpenStreamWithSeLobHandle
sqlmin!RowsetNewSS::OpenWithSeLobHandle
sqlmin!CBlobHandleBaseTableFactory::PilbGet
sqlTsEs!CompareLegacyLobNull

My understanding is that SQL Server makes an HTTP request to the blob storage in preemptive mode in order to queue an asynchronous I/O. The preemptive wait ends and the PAGEIOLATCH_SH wait begins shortly after. The traditional I/O wait ends when the I/O is received by SQL Server. That’s just a guess though.

I think a reasonable summary is that you should expect to see PREEMPTIVE_HTTP_REQUEST waits if you’re performing I/O against Azure storage. They are a normal part of SQL Server’s operations.

Reducing ACCESS_METHODS_DATASET_PARENT Latch Wait Time

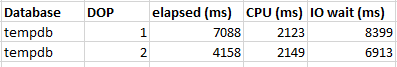
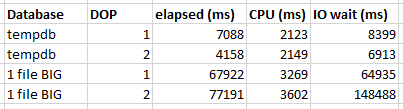
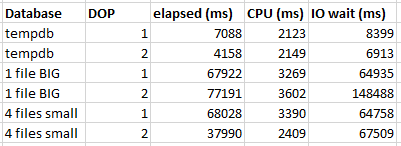
In some situations, a query that is slow due to I/O performance can run faster with a higher DOP. Instead of one thread waiting for I/O you can have many threads waiting and overall runtime will decrease. Of course, this won’t work in all scenarios, such as if you’re hitting an IOPs limit. For my scenario, the DOP 8 query had 6.7 LATCH_EX wait seconds per second of runtime. Latch contention is so bad that it nearly steals all of the theoretical benefits achieved with query parallelism.

The obvious solution is to reduce the amount of I/O that is done by the query. That is what was indeed done to resolve the production issue. Another obvious solution is to improve I/O performance. More on that in the next section. However, in some cases the query may simply need to scan a lot of data and you can’t do anything about storage performance. In that situation, it may sometimes be practical to change the type of parallel scan performed by SQL Server.

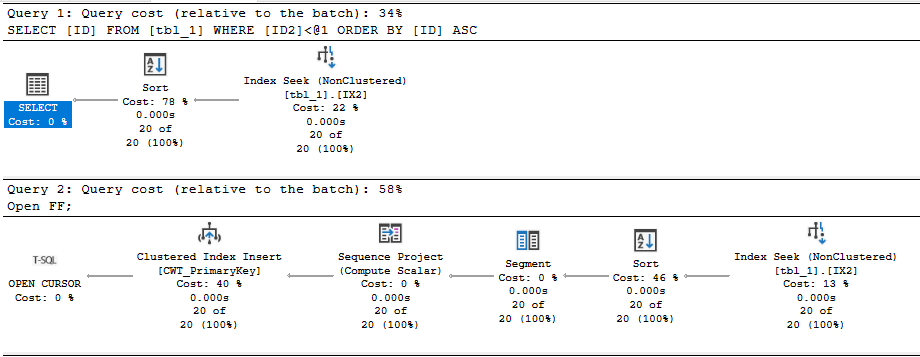
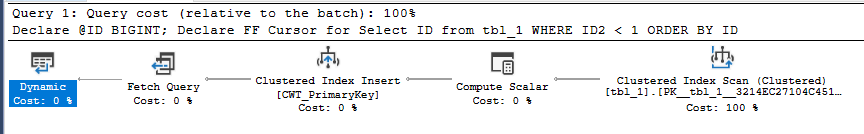
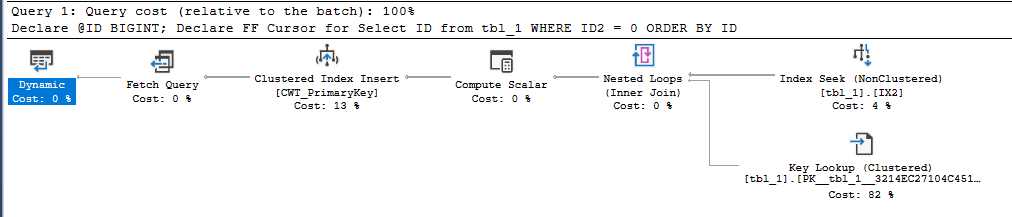
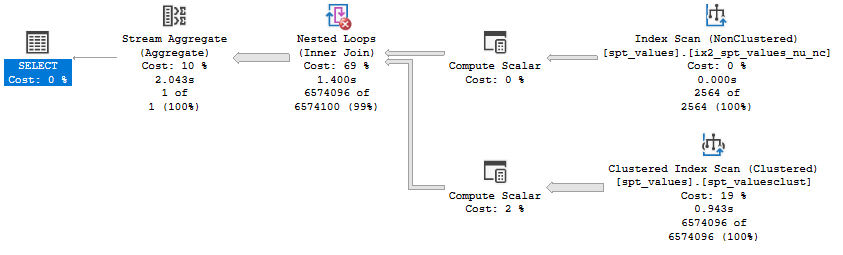
Consider the following parallel plan against a partitioned table on the probe side:

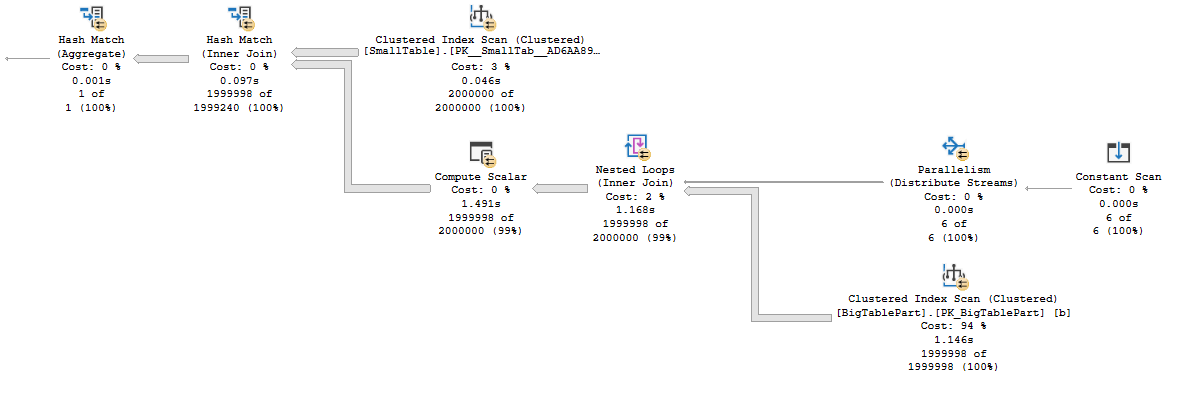
For clarity, here is what the T-SQL looks like:

SELECT SUM(Case WHEN OffPageFiller IS NOT NULL THEN 1 ELSE 0 END)
FROM (
      VALUES (1),(2),(3),(4),(5),(6)
) v(v)
CROSS APPLY(
       SELECT OffPageFiller
       FROM dbo.SmallTable s
       INNER JOIN dbo.BigTablePart b ON s.JoinId = b.JoinId
       WHERE b.PartId = v.v
) q;

Each thread of the parallel nested loop operator gets assigned an entire partition and reads all of the data for that partition. There is no longer a need for the ACCESS_METHODS_DATASET_PARENT latch because the shared state between worker threads has been removed. I checked using extended events and found that the ACCESS_METHODS_DATASET_PARENT latch wait count was significantly decreased as expected. I suspect that the remaining latch acquisitions were from the hash build side scan. This type of access pattern requires a partitioned table, can be a pain to express in T-SQL, and may not work well if partitions are unevenly sized or if there aren’t enough partitions compared to DOP to get good demand-based distribution.

Perhaps a more reasonable option is to switch to columnstore instead. The query will do less I/O and I assume that the latch pattern is quite different, but I didn’t test this. Testing things in the cloud costs money. Maybe I should start a Patreon.

Reducing PREEMPTIVE_HTTP_REQUEST Wait Time

As I said earlier, I believe that seeing this wait is normal if you’re using azure storage. In my limited experience with it, any noticeable wait time was always tied to even longer PAGEIOLATCH waits. Tuning the query using traditional methods to reduce I/O wait time was always sufficient and I never had a need to specifically focus on PREEMPTIVE_HTTP_REQUEST. However, if you really need to focus on this wait type in particular for some reason, I’ll theorize some ways to reduce it:

  1. For all platforms, reduce I/O performed by the query using query tuning, schema changes, and so on.
  2. For managed instances, move your I/O from user databases to tempdb (it uses locally attached storage).
  3. For azure blob storage databases, make sure that you are using the right geographical region for your storage.

Here are a few more options which may not specifically reduce PREEMPTIVE_HTTP_REQUEST wait time but may improve I/O performance overall:

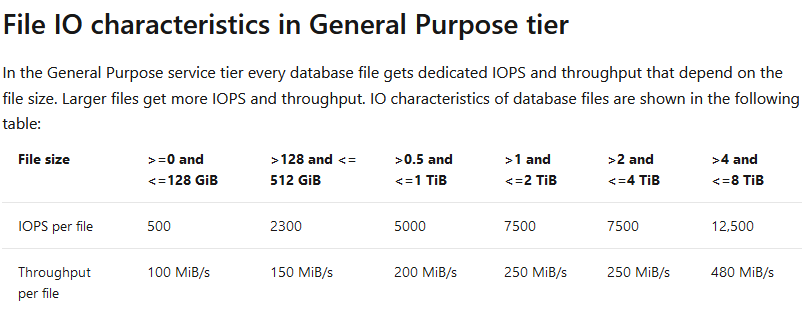
  1. For managed instances and azure blob storage databases, try increasing the size of your data files.
  2. For managed instances, try increasing the number of data files.
  3. For all platforms, switch to a more expensive tier of storage.

Final Thoughts

The query timed out in production because it performed a large parallel scan against a table that had little to no data in the buffer pool. PAGEIOLATCH waits were not the dominant wait type due to high latency from Azure blob storage. That high latency caused latch contention on the ACCESS_METHODS_DATASET_PARENT latch. My parallel scan was slow because cloud storage isn’t very fast. Maybe it isn’t so complicated after all?

Why does FAST_FORWARD make some cursors so much faster in SQL Server?

If you’re like me, you started your database journey by defining cursors with the default options. This went on until a senior developer or DBA kindly pointed out that you can get better performance by using the FAST_FORWARD option. Or maybe you were a real go-getter and found Aaron Bertrand’s performance benchmarking blog post on different cursor options. I admit that for many years I didn’t care to know why FAST_FORWARD sometimes made my queries faster. It had “FAST” in the name and that was good enough for me.

Recently I saw a production issue where using the right cursor options led to a 1000X performance improvement. I decided that ten years of ignorance was enough and finally did some research on different cursor options. This post contains a reproduction and discussion of the production issue.

A Dramatic Example

The code below creates a 16 GB table. It has a primary key and clustered index on the ID column and a nonclustered index on the ID2 column. You can adjust the TOP value to insert fewer rows if you wish to create a smaller table, but don’t drop it below 200000.

DROP TABLE IF EXISTS tbl_1;

CREATE TABLE tbl_1 (
ID BIGINT NOT NULL,
ID2 BIGINT NOT NULL,
PAGE_FILLER VARCHAR(5000) NOT NULL,
PRIMARY KEY (ID)
);

INSERT INTO tbl_1 WITH (TABLOCK)
SELECT RN, RN % 100000, REPLICATE('Z', 5000)
FROM
(
	SELECT TOP (2000000) ROW_NUMBER() OVER (ORDER BY (SELECT NULL)) RN
	FROM master..spt_values t1
	CROSS JOIN master..spt_values t2
) q
OPTION (MAXDOP 1);

CREATE INDEX IX2 ON tbl_1 (ID2);

Consider the following select query, which is a simplified example of the production query:

Select ID
from tbl_1
WHERE ID2 < 1
ORDER BY ID;

There’s an index on ID2 and the filter is highly selective: only 20 rows out of 2 million will match. I would expect the query optimizer to use that index and for the query to finish instantly. The following stored procedure defines a FAST_FORWARD cursor for that SELECT query, fetches the 20 matching rows, and does nothing with them:

CREATE OR ALTER PROCEDURE CURSOR_WITH_FF
AS
BEGIN
SET NOCOUNT ON;

Declare @ID BIGINT;

Declare FF Cursor FAST_FORWARD for
Select ID
from tbl_1
WHERE ID2 < 1
ORDER BY ID;

Open FF;
Fetch Next from FF into @ID;
WHILE @@FETCH_STATUS = 0
BEGIN
	Fetch Next from FF into @ID;
END;
Close FF;
Deallocate FF;
END;

Executing the stored procedure takes about 2 ms on my machine. In this case, I get a query plan that’s very similar to what I’d get by running a simple SELECT query. There’s some additional cursor garbage, but that doesn’t impact performance in this case:

SQL Server Query Plan

Regrettably, the code takes 50 seconds to execute on my machine if I remove the FAST_FORWARD option. What is responsible for the dramatic difference in runtime?

The “What”

We can start by looking at the query plan for the default cursor:

SQL Server Query Plan

The query optimizer decided to do an ordered clustered index scan instead of using the IX2 index. We’re getting all rows from the cursor so we have to read through the whole table. That’s 20 scans with each scan covering about 5% of the table. We should definitely expect this to be less efficient than the FAST_FORWARD plan, but a 50 second execution time felt too slow based on what I know about my hardware. Looking at the wait stats:

SQL Server Query Plan

It’s certainly not surprising that I/O is the biggest contributor to wait time (what else would it be?), but why do I have so much I/O wait time when I have fast, locally attached storage with an average latency less than 1 ms? For a comparison test, I decided to force the query plan that the cursor picks but to run it outside of the cursor. The following code finished in about 8 seconds on my machine:

CHECKPOINT;
DBCC DROPCLEANBUFFERS;

Select ID
from tbl_1 WITH (INDEX(1))
WHERE ID2 < 1
ORDER BY ID
OPTION (MAXDOP 1);

Using sys.dm_io_virtual_file_stats, I found that the cursor was doing about 240000 I/Os with an average I/O size of 66 KB. The single SELECT query did about 10000 I/Os with an average I/O size of 1.7 MB. The key difference is that only the first query execution of the cursor is able to get read-ahead reads:

SQL Server Query Plan

For the cursor execution, we don’t get read ahead reads for 95% of the I/O needed for the query. Even a sub-ms I/O latency can be painful when you have to do 240000 I/Os with a DOP 1 query. In summary, the FAST_FORWARD cursor is able to use an index to efficiently seek to the 20 matching rows. The cursor with default options does about 15 GB of I/O that’s not eligible for read-ahead reads.

Of course, the situation should be expected to be much worse in the cloud. Using the quoted latency of 5-10 ms for general purpose Managed Instances, one might expect the cursor with default options to take between 20 and 40 minutes. Just for fun, I decided to test it against a 4 vCore Managed Instance. The cursor with the FAST_FORWARD option took about 120 ms. The cursor with default options took about 70 minutes. Here are the wait stats for the execution:

SQL Server Query Plan

To put a positive spin on it: using the correct cursor options improved performance by 35000X on the Managed Instance.

The “Why”

I’ll start by saying that I don’t want to be a cursor expert. I’d much rather be an expert in not using cursors. I was having a lot of trouble explaining why the default cursor was getting such a bad query plan, but fortunately I was scooped 12 years ago. I’m going to reproduce the entire section on dynamic plans because you never know when a Microsoft hosted blog post will disappear:

A dynamic plan can be processed incrementally. In SQL Server we do this by serializing the state of the query execution into what we call a marker. Later, we can build a new query execution tree, use the marker to reposition each operator. Moreover, a dynamic plan can move forwards and backwards relative to its current position. Dynamic plans are used by both dynamic and some fast_forward cursors.

A dynamic plan consists only of dynamic operators — operators that support markers and moving forwards and backwards. This corresponds closely, but not exactly, to the query processing notion of streaming operators (vs. stop-and-go). But not every streaming operator is dynamic. In SQL Server, dynamic means:

1. The operator can be repositioned to its current position using a marker, or to a relative position (either next or previous) from its current one.

2. The operator’s state has to be small, so the marker can be small. No row data can be stored in the operator. In particular, no sort table, hash table, or work table. Not even one row can be stored, since a single row can be very large.

Without a dynamic plan, the cursor would need temporary storage to keep the query result set (or keyset thereof). A dynamic plan does no such thing! However, certain operators are disqualified — hash join, hash agg, compute sequence, and sort, for example. This leads to sub-optimal plans.

In short, you can consider a dynamic plan to be similar in concept to a plan with no blocking operators, but there are some additional restrictions. Reliable sources tell me that a cursor with default options will always pick a dynamic plan if one is available. For our SELECT query, a dynamic plan is indeed available. The ordering of the clustered index can be used to return sorted rows without doing an explicit sort. The IX2 index cannot be used for ordering because I’m filtering on ID2 with an inequality. Changing the query to do an equality filter instead allows for a dynamic plan that uses the IX2 index:

SQL Server Query Plan

What about cursors without default options? Going back to the original query, specifying the STATIC or KEYSET option avoids the bad query plan and uses the IX2 index to do an index seek. Both of those options write the cursor result set to a table in tempdb, so it makes intuitive sense that there wouldn’t be some kind of restriction that forces a clustered index scan.

Specifying the FAST_FORWARD option allows the query optimizer to pick between a static and dynamic plan. In this case, the static plan is obviously much more efficient, and the query optimizer is aware of that. It picks the static plan that doesn’t do the clustered index scan.

For completeness, specifying the READ_ONLY option also results in the index seek, as long as the DYNAMIC option isn’t also specified.

In general, I would say that FAST_FORWARD is still a good starting point for your cursors as long as your application code allows for the restrictions that come with it. FAST_FORWARD alone isn’t always sufficient to get query performance that is similar to what you’d get with a standard SELECT. As Erik points out, you’ll end up with a MAXDOP 1 query with that option. The query optimizer may also choose a worse dynamic plan instead of a static plan if the estimated query plan costs don’t reflect reality. Using STATIC instead of FAST_FORWARD can be quite helpful in some cases, but you’ll have to test your cursor specifically to know for sure. Of course, you may be able to write your code without using a cursor instead.

Insufficient Permissions

As someone always on the lookout for cool demos, this bit of the documentation caught my eye:

If a DECLARE CURSOR using Transact-SQL syntax does not specify READ_ONLY, OPTIMISTIC, or SCROLL_LOCKS, the default is as follows:

If the SELECT statement does not support updates (insufficient permissions, accessing remote tables that do not support updates, and so on), the cursor is READ_ONLY.

Could I get better performance by running the code as a login with less privileges? Sadly, I couldn’t get this to work. I verified that the lowly ‘erik’ login couldn’t modify data in the table but I got the same query plan as before. There was also no change in the properties column from the sys.dm_exec_cursors DMF.

I don’t know if the documentation was wrong or if I was doing something wrong on my end. I’d be interested in seeing a working repro of this if anyone has one.

Final Thoughts

Some query patterns can experience extremely poor performance with the default cursor options. You may be able to identify these queries by sorting by total logical reads in the standard SSMS query store reports. In our production environment we had a few cursors that were doing far more logical reads than anything else on the database, so they were easy to pick out. We were able to significantly speed up some of those queries just by adding the FAST_FORWARD option.

Thanks for reading!

Going Further


If this is the kind of SQL Server stuff you love learning about, you’ll love my training. I’m offering a 75% discount to my blog readers if you click from here. I’m also available for consulting if you just don’t have time for that and need to solve performance problems quickly.

Trying out the new premium-series Azure SQL Managed Instances

At Microsoft Ignite 2021, public preview for new “premium-series” hardware was announced for Azure SQL Managed Instances. There’s even a black friday sort of sale during this month where you can do testing on premium-series VMs without paying for the compute costs. As someone without free cloud bucks: sign me up!

I did some basic query benchmarking to get an idea of the performance difference between the new premium VMs and the standard gen 5 VMs. The test VMs aren’t identical in specs: the standard-series has 4 vCore with 20.4 GB of memory and the premium-series has 8 vCore with 56 GB of memory. I will attempt to call out any situations where that spec difference had a measurable impact.

What is an Intel 8370C processor?

When I see an Intel CPU model that I’m not familiar with, the first thing I do is try to look it up on the Intel Ark website. Unfortunately, like other cloud specific CPUs, there is no information available there on the Intel 8370C. I did try to ask around but I didn’t get very far. Here’s everything that I know:

  • 3rd Generation Intel® Xeon® Scalable Processors
  • Ice Lake code name
  • At least 24 cores per socket
  • 2.8 GHz base
  • Turbo clock speed of 3.5GHz
  • Intel Turbo Boost Technology 2.0
  • Intel AVX-512
  • Intel Deep Learning Boost

That will have to do. It’s a bit annoying trying to compare on-prem performance numbers to MI when we don’t have full details about the processor in the cloud, but this seems to be how it is.

What is a Managed Instance vCore?

There are a few things that you need to know in order to put a vCPU or vCore count into perspective:

1) What is the hardware in the physical host? For Managed instances, we know that the gen 5 series physical hosts have Intel E5-2673 v4, SP-8160, or 8272CL processors. For the premium-series, we know that the physical hosts only have Intel 8370C processors. We may not know exactly what those processors are, but we at least have some information.

2) How are the logical cores in the VM spread over the physical costs of the physical host? In other words, are 4 vCores generally spread over 2 physical cores on the host or are they spread over a single hyperthread each from four different physical cores? Those configurations will result in very different application throughput. In a blog post that I haven’t written yet, I present evidence that you should think of Managed Instance VMs as being spread over the minimum number of physical cores on the host. In other words, a 4 vCore VM will at most get 2X the throughput of a single query running at MAXDOP 1.

3) How much CPU oversubscription is there at the physical host level? Your VM may be fighting for CPU time with other VMs on the same physical host. With MI, you only have access to the SQL Server instance. As far as I know, there really isn’t a way to tell if your query runtime is getting penalized due to activity by some other VM. I’ve seen query performance degrade on MI instances with nothing else going on. The only way that I know to explain it is some kind of oversubscription at the host level. Note that Microsoft only offers compute isolation for standard-series VMs at 40+ vCores and for premium-series VMs at 64+ vCores.

You might be wondering why I’m writing all of this in a blog post about query performance testing. The reason is simple: CPU time at the individual query level may be a significantly less consistent performance metric on Managed Instances compared to what you’re used to. As an example from this round of testing, the same query used both 1289 ms of CPU and 1929 ms of CPU under conditions that appeared to be identical. Both hyperthreading and VM oversubscription can contribute to “inflated” CPU times. You might be getting time on one of the processor’s logical cores but that time is shared with whatever else may be running on the other logical core. And who even knows what HyperV is doing in terms of scheduling?

With that said, I did not observe the wild variances in CPU time on the premium-series VM. I suspect that this is a property of the public preview nature of the VM. Still, I ran all queries five times each and averaged the results to mitigate the CPU variance problem. When query tuning on Managed Instances in the real world, do note that if your rewrite reduces CPU time by 20%, you may have not accomplished anything. You’ll need to test performance many times or evaluate performance in a different way, perhaps by examining the query plan shape or (gasp!) looking at logical reads.

While Loop Test

The first test that I did was the simple WHILE loop described here. Managed Instances have significant observer overhead for this code compared to a vanilla SQL Server install. Perhaps it has something to do with all of the extended event sessions mentioned in the MI error log. It could be said that testing this T-SQL is really just benchmarking that observer overhead. However, it’s still CPU work, so why not do it?

The premium-series VM took an average of 663 CPU ms compared to 1043 CPU ms for the standard VMs.

Cross Join Test

For the next test case, I wanted to reduce the observer overhead but still execute a CPU-bound query with a minimum of time lost to waits. I decided on the following query which calculates 6.5 million checksums:

SELECT MIN(CHECKSUM(CAST(t1.number AS BIGint) + CAST(t2.number AS BIGint)))
FROM master..spt_values t1
CROSS JOIN master..spt_values t2
OPTION (MAXDOP 1, NO_PERFORMANCE_SPOOL);

The query plan isn’t very exciting:

The premium-series VM took an average of 1277 CPU ms compared to 1876 CPU ms for the standard VMs.

Batch Mode Test

I also wanted to run a query that does some batch mode work without spilling to tempdb. I don’t know if it applies here, but in some cases, CPUs with newer instruction sets can get better performance with batch mode operations. First I created a simple CCI:

CREATE TABLE dbo.BatchModeTest (
ID1 BIGINT NOT NULL,
ID2 BIGINT NOT NULL,
ID3 BIGINT NOT NULL,
STRING VARCHAR(100),
INDEX CCI CLUSTERED COLUMNSTORE
);

INSERT INTO dbo.BatchModeTest WITH (TABLOCK)
SELECT q.RN, q.RN, q.RN, REPLICATE('Z', 100)
FROM
(
    SELECT ROW_NUMBER() OVER (ORDER BY (SELECT NULL)) RN
    FROM master..spt_values t1
    CROSS JOIN master..spt_values t2
) q
OPTION (MAXDOP 1);

I then tested the performance of the following query:

SELECT COUNT_BIG(DISTINCT ID1)
FROM BatchModeTest
OPTION (MAXDOP 1);

The premium-series VM took an average of 724 CPU ms compared to 1162 CPU ms for the standard VMs.

On a batch mode related note, I observed that Managed Instances don’t seem to have the fix for the “queries on CCIs can get trivial plans which result in no batch mode” issue that was addressed with SQL Server 2017. I sent this feedback to Microsoft and it was received positively, so perhaps there will be an update one day on Managed Instances that addresses that problem. I have to admit that I’m curious as to how such a situation is possible. Are there other fixes that haven’t been ported to the Managed Instance bits yet? Performance tuning in the cloud is difficult enough without the absence of performance fixes implemented years ago in the boxed product!

Application Query Tests

I also tested two of our application queries which are known pain points for our end users. I am not able to share any information about the queries, but you may consider them to be significantly more “real world” compared to the previous tests done so far. As with the other tests conducted so far, both queries used significantly less CPU time on the premium-series managed instance. Here are all of the performance testing results so far:

I will note once again that the VMs aren’t identical in specs: the standard-series has 4 vCore with 20.4 GB of memory and the premium-series has 8 vCore with 56 GB of memory. With that said, tempdb spills would have contributed to at most a 30 ms difference in CPU time for the application queries.

Maintenance Tests

By popular demand, I also tested a few maintenance activities. I ran DBCC CHECKTABLE against one of the largest tables in the database. It took 44 seconds to complete on the premium-series and 65 seconds to complete on the standard-series.

Rebuilding an index of a table was more interesting. The premium-series VM took significantly longer than the standard-series: 209 seconds vs 158 seconds. However, the premium-series tests used significantly less CPU: 55 seconds vs 109 seconds. I saw a lot of LOGBUFFER waits on the premium-series VM that weren’t observed on the standard-series. As far as I can tell, storage performance should have been identical between the two VMs. Perhaps I just got unlikely, or maybe the root cause of this difference will be addressed before premium-series VMs become generally available.

Final Thoughts

Based on limited public preview results, the new premium-series VMs are significantly more CPU efficient than the standard-series VMs for several different types of queries. I saw a 40% reduction in CPU time across the board in my testing. Workloads with queries that are CPU bound may be able to reduce their overall vCore count and still see improved query performance by switching to the premium-series VMs. For our workload, based on the information that I have, I would prefer a 24 vCore premium-series VM over a 32 vCore standard-series VM. It’s a cheaper option with slightly more memory and more CPU power. Other workloads that aren’t as CPU bound may not see the same benefits from switching to the Intel 8370C. Perhaps the 15% price premium isn’t worth it in all cases.

For VM sizes that don’t qualify for compute isolation (fewer than 64 vCores), I suspect that these test results are biased in favor of the premium-series. It’s just speculation on my part, but I didn’t see the kind of oversubscription at the host level with the premium-series that I’m used to seeing on the standard-series MI VMs. It is possible that the premium-series VMs will have less of a performance advantage compared to the standard-series once they become generally available.

I’ll add that databases platforms, and software in general, are supposed to serve us and make our lives easier. Too often it feels like we’re the ones serving the database platforms instead. That’s part of why I’m such a big advocate for using the right hardware for your important relational database workloads. It’s really hard to get excited when spinning up a new Managed Instance VM only to get something on an E5-2673 v4 physical host. That doesn’t sound like the right hardware to me.

Thanks for reading!

Azure Managed Instance Doesn’t Manage tempdb Well

Update!


You can now configure size and autogrowth settings for tempdb, but the article doesn’t mention anything about in-memory settings.

Twelve Angry Files


This post is admittedly short, but since we’re short of First Party Solutions™ to gripe to Microsoft with… I need to save this stuff somewhere.

  1. You get 12 tempdb files, even if your instance has 16, 24, 32, 40, 64, or 80 cores
  2. There’s no way to turn on in-memory tempdb
death of auto tune

If your workload is tempdb-heavy, and you have a special configuration for it on-prem, you might have a tough time moving it to Managed Instance. Also consider that disk performance (even though tempdb is “local”) is garbage, and you can’t do anything about it.

I think the lack of in-memory tempdb is odd too, since many features are cloud-first. One may wonder aloud why a performance feature that’s a couple years old now still isn’t available in flagship business critical cloud offerings.

It was only recently (September 2021) that scalar UDF inlining became available up in Azure SQL DB and Managed Instance.

Who’s really on the cutting edge? All those stodgy holdouts hanging about in their earthly garb.

Thanks for reading!

Going Further


If this is the kind of SQL Server stuff you love learning about, you’ll love my training. I’m offering a 75% discount to my blog readers if you click from here. I’m also available for consulting if you just don’t have time for that and need to solve performance problems quickly.

Simple test results for query I/O performance on Azure SQL Managed Instance

Lately I’ve been doing some exploratory performance testing on Azure SQL Managed Instances in preparation for a migration to that platform. This blog post documents some storage testing results and may even have practical advice near the end. All testing was done on a gen5 general purpose instance with 8 vCores.

The Test Query

The test case is relatively simple. I want to do about 1 GB of physical reads without doing any read-ahead reads. To accomplish that, I loaded 130k rows into a table making sure that only one row could fit on each data page. I also wrote a simple nested loop join query that doesn’t allow for nested loop prefetching. Here’s a picture of the query plan:

The presence of the concat operator on the inner side of the nested loop prevents the prefetch optimization. This limitation is unusually annoying, but I’m using it to my advantage here to stress I/O as much as I can. Here’s the T-SQL used to generate the query plan in the picture:

use tempdb;
 
CREATE TABLE #outer (
    ID BIGINT IDENTITY(1, 1) NOT NULL,
    DUMMY BIGINT NOT NULL,
    PRIMARY KEY (ID)
);

INSERT INTO #outer (DUMMY)
SELECT TOP (130000) 0
FROM master..spt_values t1
CROSS JOIN master..spt_values t2;


CREATE TABLE #inner (
    ID BIGINT IDENTITY(1, 1) NOT NULL,
    BIG_DUMMY CHAR(5000) NOT NULL,
    PRIMARY KEY (ID)
);

INSERT INTO #inner (BIG_DUMMY)
SELECT TOP (130000) '0'
FROM master..spt_values t1
CROSS JOIN master..spt_values t2;

CHECKPOINT;
DBCC DROPCLEANBUFFERS;
 

SELECT COUNT_BIG(*)
FROM #outer o
WHERE o.DUMMY = 1
OR EXISTS (
    SELECT 1
    FROM #inner i
    WHERE i.ID = o.ID
)
OPTION (MAXDOP 1, QueryRuleOff BuildSpool);

For the different cases, I ran the SELECT query at MAXDOP 1 and MAXDOP 2 and cleared the buffer pool before each query execution.

Is Tempdb no longer the outhouse?

For user databases on managed instances, the documentation states that you should expect I/O latency of around 5-10 ms. However, tempdb is attached locally so we might get better latency there. Wanting to start off on a positive note, I elected to try testing in tempdb first. Here are the test results for the tempdb database:

The managed instance spends more time waiting for I/O compared to testing on my local machine’s tempdb, but the MAXDOP 2 query has the nice property of nearly being twice as fast as the MAXDOP 1 query. Both queries on the managed instance have roughly the same amount of I/O wait time. The MAXDOP 2 query is primarily faster because the I/O waits are spread fairly evenly between both threads. I will note that I was a bit lazy with my test query and I didn’t ensure that an appropriate amount of work is sent to each thread, but things worked out well enough for this kind of test.

My next test was performed in a user database that was created solely for the purpose of this testing. The initial database size was about 1.5 GB. The code is the same as before, but I just created user tables instead of temp tables. The test results were not good. Both queries ran for over a minute and the MAXDOP 2 query was slower than the MAXDOP 1 query. The documentation says the following:

If you notice high IO latency on some database file or you see that IOPS/throughput is reaching the limit, you might improve performance by increasing the file size.

In this case, I might improve performance if I increase my data file size to greater than 128 GB. I didn’t want to do that for a few reasons:

  1. It costs money and I don’t like spending money.
  2. There’s an instance level storage limit of 2 or 8 TB for general purpose (depending on vCore count).
  3. Creating a database with 99% free space is silly and a well-meaning DBA could shrink it without realizing the performance implications.

For you, dear reader, I increased the database size to 132 GB. I did not observe any performance improvements after doing so, despite testing many times. Here are the test results so far:

Tempdb has 12 data files btw

The chart below makes me wonder if creating multiple files for a small database would be helpful:

If I can get 500 IOPS per database file and I have four database files, logically speaking I would expect to get 2000 IOPS for a single database with four files. I’m personally a big fan of databases with multiple files. I’ve seen a lot of performance problems fixed or mitigated by going beyond the default one data file per database rule.

There is at least one downside to creating multiple small files for one database on managed instances: there’s a documented limit of 280 total files for the general purpose tier. This limit is there because each file takes up a minimum of 128 GB on the storage backend and a general purpose instance can only use up to 35 TB of storage on the backend: 280 * 128 = 35 * 1024. It is amusing to consider how master, model, and msdb take up about 750 GB of storage behind the scenes.

On my instance, I’m nowhere near the 280 file limit/35 TB storage backend limit, so I created a small database (significantly below 128 GB) with about 4 files and tested the query again. Here are the full results:

MAXDOP 1 query performance is pretty much the same as before, but the MAXDOP 2 query runtime decreased from 77 seconds to 37 seconds. That’s a huge improvement. The MAXDOP 2 query is also roughly twice as fast as the MAXDOP 1 query which is nice to see. The only thing that I did to improve parallel query performance was to create a new database with 4 data files instead of 1.

Practical Applications

To get the obvious out of the way: if you’re writing temporary data to user tables instead of temp tables on Managed Instance, you probably shouldn’t be doing that.

I don’t have any production workloads in managed instances yet, but I’ll go ahead and attempt to give some guidance on file counts. You should consider exceeding 1 data file per database if all of the following are true:

  1. Your database is under 128 GB
  2. You care about I/O performance for that database or your I/O waits for that database are higher than you’d like
  3. Your instance isn’t close to the 35 TB backend limit

It will always be workload dependent, but you may see a performance improvement by splitting your database into multiple files. Do note that you’ll need to spread your data over all of the files (rebuild your tables and indexes after adding files) and you’ll want the files to be the same sizes with the same autogrowth settings. Also, there are other situations where you may want more than one data file for a database. Do not interpret the above to mean that databases already above 128 GB only need a single file.

If you’ve got a managed instance with only one database, perhaps you’re wondering if it would be a good idea to give it 96 data files. In theory, that will allow that database to hit the instance IOPS limit of 30k-40k. I can say that I’ve run with 96 file user databases in Enterprise and I didn’t observe any issues other than an annoying initial setup. The scenario for that was a large ETL system and I was trying to reduce PFS and GAM contention, so it’s quite a bit different than what you would run on a managed instance.

I would be somewhat cautious with creating significantly more data files for one database than your vCore count. In that configuration, I would also try to avoid excess autogrowth events as that is one place you might run into trouble. In general, when doing unusual things, you should test very carefully. That same advice is applicable here. It might work out well or it might not help at all. Stop asking me, I’ve used the cloud for like a week.

Final Thoughts

In some scenarios on Azure SQL Managed Instances, you may be above to improve I/O performance for small databases FOR FREE by spreading your data over multiple data files. Isn’t that wonderful?

Thanks for reading!