What’s The Point Of DOP Feedback In SQL Server 2022?

Loud Engine


If you’re ever on a long flight and want something to fall asleep to, ask a DBA how to set MAXDOP.

Sometimes I even ask myself that question when I’m tossing and turning at night.

There are a lot of things to consider when fixing settings globally across a workload. For parallelism, it’s less about individual query performance, and more about overall server/workload performance

After all, letting every query go as absolutely parallel as possible is only good up to a point; that point is usually when you start regularly running out of worker threads, or your CPUs could double as crematoriums.

Setting MAXDOP is about limiting the damage that a parallel workload can do to a server. The expectation is that a query running at DOP 8 will run 8x faster than a query running at DOP 1.

But setting MAXDOP for every query isn’t something you catch even the most persnickety performance tuners doing. Perhaps some of the more critical ones, but you know…

Let Me Rust


I’m not going to demo DOP feedback in this post, I’m just going to show you the situation that it hopes to improve upon.

To do that, I’m going to run a simple aggregation query at different degrees of parallelism, and show you the changes in query timing.

At DOP 1:

The query runs for 1.1 seconds, with 886ms consumed while scanning the Posts table.

SQL Server Query Plan
DOPPER DON

At DOP 2:

The query runs just about twice as fast, starting with the scan of the Posts table taking about half as long. This is good scaling. Add one CPU, go twice as fast as you did with one CPU.

SQL Server Query Plan
Rip Van Winkle

At DOP 4:

The gets about twice as fast again! The scan of the Posts table is now down to 263ms, and the query in total is at 330ms. Adding in two more cores seems a good choice, here.

SQL Server Query Plan
Bed Rock

At DOP 8:

The query no longer continues to get 2x faster. This isn’t a knock against DOP 8 in general; my query just happens to hit a wall around DOP 4. With 4 additional CPUs, we only save ~130ms at the end of the day.

SQL Server Query Plan
Anubis

Why This Is Cool


This new feature will help DBAs have to worry less about getting MAXDOP absolutely right across the board. Who knows, we may even see a day where MAXDOP is left at zero.

But you’d never skip that installer step, would you?

Anyway, for anyone out there who is paranoid about setting DOP too high, this should help your queries find a more approximately-good middle ground.

Hopefully it works as advertised.

Thanks for reading!

Going Further


If this is the kind of SQL Server stuff you love learning about, you’ll love my training. I’m offering a 75% discount to my blog readers if you click from here. I’m also available for consulting if you just don’t have time for that and need to solve performance problems quickly.

Common SQL Server Consulting Advice: Setting MAXDOP And Cost Threshold For Parallelism

Dirty Work


There are three classes of administrator when it comes to parallelism settings

  • Never changed the defaults
  • Changed the defaults to something wacky
  • Changed the defaults to something safe

The beginning of this post is for the first couple of genus of administrator.

Even though Microsoft added a MAXDOP calculation to the installer starting with SQL Server 2016, I’ve seen cases where the recommended setting was wrong because hardware changed after the initial config.

As an example: Your VM admin created the smallest possible machine to get things set up for you, and added CPU and memory later on, and you ended up with MAXDOP set to 1.

The installer still doesn’t let you change Cost Threshold For Parallelism at setup, which is plum bizarre. I get why making a recommendation here is hard (and I’ll talk about that later on), but you should at least give folks the option.

I want to add this here, before we get too far along: The point of adjusting these values is not “because there’s too much parallelism” or “because there’s too much CX… waits”. The goal is to increase concurrency by only allowing queries that benefit from parallelism to use it, because parallel queries can reserve many CPU threads (DOP * parallel branches), and if you throw enough of them at a server you can end up running out of worker threads, and hitting THREADPOOL waits.

Some folks do Good Enough© with the stock advice of a max degree of parallelism of 4 to 8, and cost threshold for parallelism of 50. Others have a harder time finding a sweet spot that properly balances performance and concurrency.

But you need to start somewhere.

If you truly have no idea how to change these settings, review these example commands, but don’t just blindly run them.

EXEC sys.sp_configure
    @configname = 'show advanced options',
    @configvalue = 1;
RECONFIGURE;

EXEC sys.sp_configure
    @configname = 'cost threshold for parallelism',
    @configvalue = 50;
RECONFIGURE;

EXEC sys.sp_configure
    @configname = 'max degree of parallelism',
    @configvalue = 8;
RECONFIGURE;

Read the rest of the post first.

Evaluating


The easy way to see your settings and if they’re relatively sane is like so:

SELECT
    c.name,
    c.value,
    c.value_in_use,
    c.description,
    socket_count = 
        CASE c.name
             WHEN N'max degree of parallelism'
             THEN osi.socket_count
             ELSE NULL
        END, 
    cores_per_socket = 
        CASE c.name
             WHEN N'max degree of parallelism'
             THEN osi.cores_per_socket
             ELSE NULL
        END
FROM sys.configurations AS c
CROSS JOIN
(
    SELECT 
        osi.socket_count,
        osi.cores_per_socket
    FROM sys.dm_os_sys_info AS osi
) AS osi
WHERE c.name IN 
(
    N'cost threshold for parallelism',
    N'max degree of parallelism'
);

Whenever I query sys.configurations, I get the value and value in use, because sometimes folks forget to run RECONFIGURE; after they change something.

But back to the point! Whatcha got here?

  • Is Cost Threshold For Parallelism a number higher than 5 and lower than 200?
  • Is Max Degree Of Parallelism an even number between 4 and 8?

If so, you probably don’t need to make any changes here, unless something else is going on.

And hey, if you’ve got one of those really awful vendor products that tells you to set MAXDOP to one, you should be using database scoped configurations for that, these days.

For most folks, this will get you to an okay place. You may have some other considerations based on the number of cores and/or sockets, and that can get pretty confusing.

Changing these setting will clear out the plan cache, so you should be a little careful when you do it, but you don’t need to restart or anything.

Thinking Harder About Cost Threshold For Parallelism


Many folks who end up here are already pretty sophisticated when it comes to SQL Server, and I’d hate to leave them hanging.

Let’s talk more about each setting, and how they interact with your server and queries.

First up, alphabetically, is cost threshold for parallelism. Right now, you can only set it at the server level. You can technically remove it from the equation by:

  • Setting MAXDOP to 1
  • Using undocumented trace flag 8649, or…
  • Using undocumented query hint ENABLE_PARALLEL_PLAN_PREFERENCE to force a parallel plan

It would be neat if you could set it at the database level, like MAXDOP, but whatever.

One thing that comes up consistently when talking about this setting is that folks often see parallel queries with costs lower than the cost threshold for parallelism. All that means is that the serial query plan broke the threshold, and the parallel plan was chosen because it was cheaper. Cheaper can be lower than cost threshold for parallelism.

When a query executes, assuming there isn’t some parallelism-inhibiting factor in place (scalar UDFs, table variable inserts, etc.), it has to “cost” more than this threshold for a parallel plan to get considered. If it does, and the optimizer can come up with a parallel plan that’s cheaper than the serial plan, then you can pretty well count on it being chosen.

This is where things get tricky! Right off the bat!

See, query costs are all estimates, and there’s no actual counterpart to them in your query plans. If you’re anything like me, you’ve probably seen some low “cost” queries run for a really long time.

Many things contribute to pinning this setting down being difficult:

  • Incorrect assumptions about too much of a CX wait (this goes for MAXDOP too)
  • Untuned workloads having consistently high cost queries
  • Wasting time looking at the plan cache for average costs
  • Changing the setting not having an appreciable effect
  • Misunderstanding what costs actually mean

What does it all mean for you? Well, usually increasing the setting from the default — which is 5 — to a meaningfully higher number, will reduce the total number of queries that are eligible for a parallel plan.

This doesn’t mean performance is doomed for those queries, heck, they may not have needed a parallel plan to begin with. The optimizer is pretty good at costing queries generally. But it’s not perfect, and that’s where generalized workload settings need to be overridden or changed.

Having fewer queries be eligible for gobbling up a whole bunch of CPU threads is one way of increasing overall concurrency. Individual query performance may change for better or worse, and you may need to raise or lower the number you picked here, but that’s part of the process.

Thinking Harder About Max Degree Of Parallelism


The second option you have to address concurrency and performance issues stemming from parallelism is setting an upper limit on the number of cores, and threads per parallel branch that a parallel query is allowed to engage and acquire.

In a way, this setting is a little easier to settle on than Cost Threshold for Parallelism, but there are some things you should be aware of:

  • The parallel version of a plan isn’t just the serial version with parallelism; you can end up with a very different set of operators
  • The optimizer may choose a serial plan if DOP is set too low for a parallel plan to make sense
  • Whatever you set DOP to, parallel plans will use at least one extra coordinator thread to manage DOP threads
  • Leaving this set to zero is only really dangerous on servers with > 8 cores
  • Setting this to an odd number is generally not a good global setting, though it can be useful in edge cases for a single query

There have been times when I’ve suggested MAXDOP of 4 on servers with a single 8 core processor, but that was mostly a temporary fix until some more meaningful tuning work could be done.

It’s okay to use these settings as band aids, just don’t let them be habit-forming.

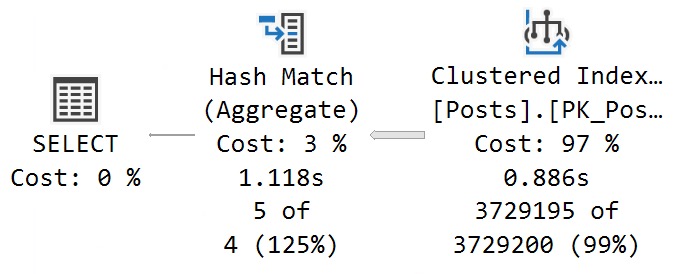
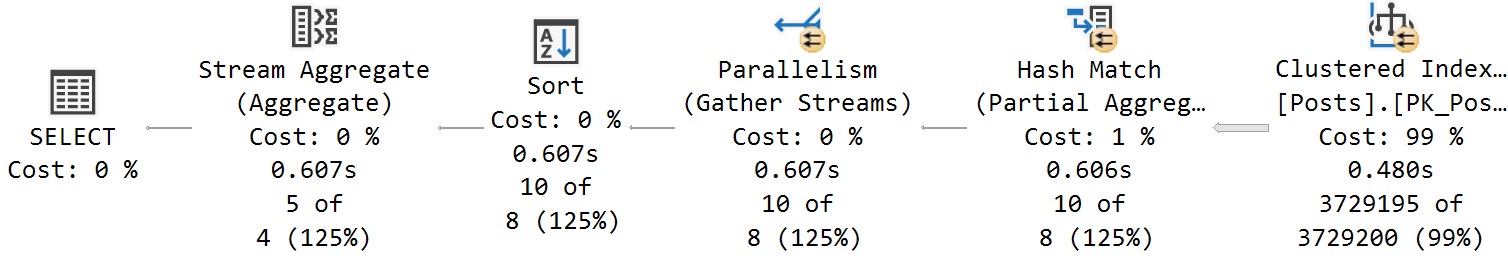
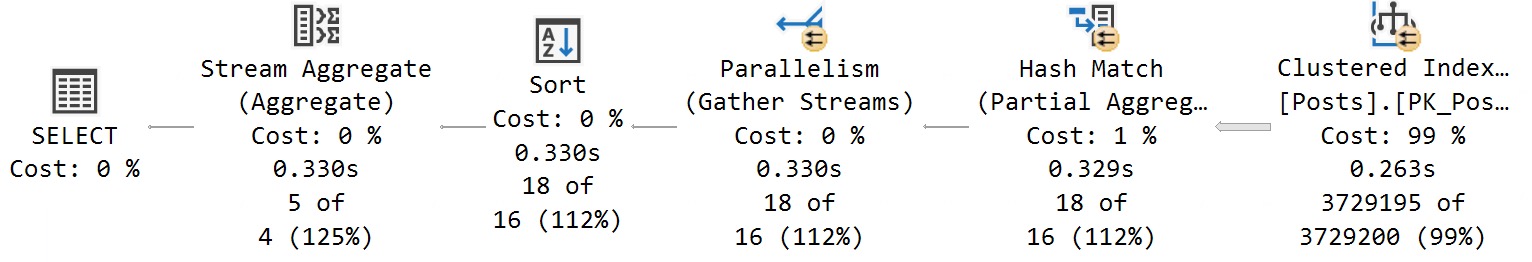
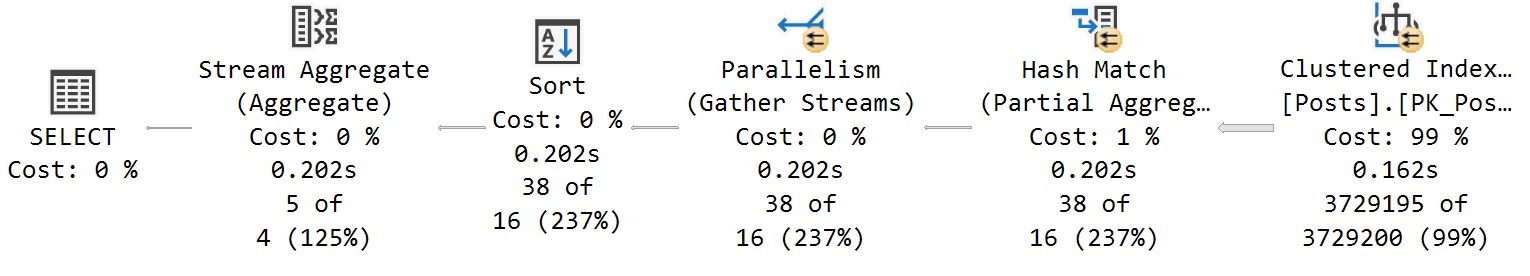
How can you tell if a parallel query plan is effective, and how can you decide if you need higher or lower DOP? Great question(s)! Look at you. I’m so proud.

  • If your parallel and serial plans have roughly equivalent CPU and duration, the parallel plan isn’t better
  • If your parallel plan isn’t anywhere near DOP faster than your serial query, the parallel plan probably isn’t better
  • If your parallel plan hits exchange spills or deadlocks, buckle up, you’re in for a fun day (of MAXDOP 1 hints)
  • If your parallel plan gets slower as you touch more data, you might want to try hinting a higher DOP

I know, it sounds kooky, but this is all stuff I have to think about and mess with when I’m tuning queries for clients. Many times, it seems like an attractive concept to force a parallel plan on a slow query, but the end result isn’t necessarily better.

It’s sort of like when I expect a query to use a nested loops join, but it doesn’t. If you hint the query to do the loop join, you might get a missing index request that lead the optimizer to think that a different join type was cheaper. Or you might just find out the optimizer was wrong. Again.

Getting back to the main point, though: parallelism is a very effective equalizer for the right kind of queries. It just doesn’t necessarily help every query.

Slug Away


To summarize and recap a little bit, here. Most SQL Server users out there will do fine following basic advice about cost threshold for parallelism and max degree of parallelism.

There will be outliers, edge cases, and times when you need to work outside of those settings for particular queries to run optimally. Heck, if a client tells me they’re running a data warehouse, the last thing I’m going to get hung up on is cost threshold for parallelism.

If you change those settings away from the defaults, and you’re still for some reason dissatisfied with the amount of CX_ waits on your server, try focusing on the queries that are going parallel and tuning them to reduce their estimated costs to lower numbers.

Sometimes those waits really are your fault.

Thanks for reading!

Going Further


If this is the kind of SQL Server stuff you love learning about, you’ll love my training. I’m offering a 75% discount to my blog readers if you click from here. I’m also available for consulting if you just don’t have time for that and need to solve performance problems quickly.

MAXDOP: The T-Shirt

Buttery Biscuits


In yesterday’s post, I showed you the promo video and abstract for my SQLBits precon.

In today’s post, I’m gonna offer you a little bribery to show up.

First, all attendees will get one of these lovely T-Shirts. I have options for MAXDOP 8 and 0 available. Because those are the only right answers. Ha ha ha.

I’m also throwing in free access to my SQL Server training library, which includes a video recap of the precon material.

See you there!

Going Further


If this is the kind of SQL Server stuff you love learning about, you’ll love my training. I’m offering a 75% discount to my blog readers if you click from here. I’m also available for consulting if you just don’t have time for that and need to solve performance problems quickly.

Starting SQL: Sorts And Memory Grants In SQL Server

Sup?


For SQL Server queries that require additional memory, grants are derived for serial plans. If a parallel plan is explored and chosen, memory will be divided evenly among threads.

Memory grant estimates are based on:

  • Number of rows (cardinality)
  • Size of rows (data size)
  • Number of concurrent memory consuming operators

If a parallel plan is chosen, there is some memory overhead to process parallel exchanges (distribute, redistribute, and gather streams), however their memory needs are still not calculated the same way.

Memory Consuming Operators


The most common operators that ask for memory are

  • Sorts
  • Hashes (joins, aggregates)
  • Optimized Nested Loops

Less common operators that require memory are inserts to column store indexes. These also differ in that memory grants are currently multiplied by DOP for them.

Memory needs for Sorts are typically much higher than for hashes. Sorts will ask for at least estimated size of data for a memory grant, since they need to sort all result columns by the ordering element(s). Hashes need memory to build a hash table, which does not include all selected columns.

Examples


If I run this query, intentionally hinted to DOP 1, it will ask for 166 MB of memory.

SELECT 
    u.* 
FROM 
( 
    SELECT TOP (1000) 
        u.Id 
    FROM dbo.Users AS u 
    ORDER BY u.Reputation 
) AS u 
OPTION(MAXDOP 1);
SQL Server Query Plan
Big Memory Grant

If I run this query (again, DOP 1), the plan will change, and the memory grant will go up slightly.

SELECT
    *
FROM
(
    SELECT TOP (1000) 
        u.Id 
    FROM dbo.Users AS u 
    ORDER BY u.Reputation
) AS u
JOIN
(
    SELECT TOP (1000) 
        u.Id 
    FROM dbo.Users AS u 
    ORDER BY u.Reputation
) AS u2
    ON u.Id = u2.Id
OPTION (MAXDOP 1);


SQL Server Query Plan
Another Memory Grant!

There are two Sorts, and now a Hash Join. The memory grant bumps up a little bit to accommodate the hash build, but it does not double because the Sort operators cannot run concurrently.

If I change the query to force a nested loops join, the grant will double to deal with the concurrent Sorts.

SELECT
    *
FROM
(
    SELECT TOP (1000) 
        u.Id 
    FROM dbo.Users AS u 
    ORDER BY u.Reputation
) AS u
INNER LOOP JOIN /*Force the loop join*/
(
    SELECT TOP (1000) 
        u.Id 
    FROM dbo.Users AS u 
    ORDER BY u.Reputation
)AS u2
    ON u.Id = u2.Id
OPTION (MAXDOP 1);
SQL Server Query Plan
Double The Memory Grant!

The memory grant doubles because Nested Loop is not a blocking operator, and Hash Join is.

Size Of Data Matters


This query selects string data of different combinations. Depending on which columns I select, the size of the memory grant will go up.

The way size of data is calculated for variable string data is rows * 50% of the column’s declared length. This is true for VARCHAR and NVARCHAR, though NVARCHAR columns are doubled since they store double-byte characters. This does change in some cases with the new CE, but details aren’t documented.

Size of data also matters for hash operations, but not to the same degree that it does for Sorts.

SELECT 
    u.* 
FROM 
( 
    SELECT TOP (1000) 
        u.Id -- 166MB (INT) 
      , u.DisplayName -- 300MB (NVARCHAR 40) 
      , u.WebsiteUrl -- 900MB (NVARCHAR 200) 
      , u.Location -- 1.2GB (NVARCHAR 100) 
      , u.AboutMe -- 9GB (NVARCHAR MAX) 
    FROM dbo.Users AS u 
    ORDER BY u.Reputation 
) AS u 
OPTION(MAXDOP 1);
SQL Server Query Plan
NINE POINT SEVEN GIG MEMORY GRANT

But What About Parallelism?


If I run this query at different DOPs, the memory grant is not multiplied by DOP.

SELECT
    *
FROM
(
    SELECT TOP (1000) 
        u.Id 
    FROM dbo.Users AS u 
    ORDER BY u.Reputation
) AS u
INNER HASH JOIN
(
    SELECT TOP (1000) 
        u.Id 
    FROM dbo.Users AS u 
    ORDER BY u.Reputation
) AS u2
    ON u.Id = u2.Id
ORDER BY
    u.Id,
    u2.Id -- Add an ORDER BY 
OPTION(MAXDOP ?);
SQL Server Query Results
Pick-A-DOP

There are slight increases to deal with more parallel buffers per exchange operator, and perhaps there are internal reasons that the Sort and Hash builds require extra memory to deal with higher DOP, but it’s clearly not a multiplying factor.

Thanks for reading!

Going Further


If this is the kind of SQL Server stuff you love learning about, you’ll love my training. I’m offering a 75% discount to my blog readers if you click from here. I’m also available for consulting if you just don’t have time for that and need to solve performance problems quickly.

Why Does My Serial Query Plan Have Parallel Wait Stats Like CXPACKET And CXCONSUMER?

Harkening


In dramatic fashion, I’m revisiting something from this post about stats updates.

It’s a quick post, because uh… Well. Pick a reason.

Get In Gear


Follow along as I repeat all the steps in the linked post to:

  • Load > 2 billion rows into a table
  • Create a stats object on every column
  • Load enough new data to trigger a stats refresh
  • Query the table to trigger the stats refresh

Except this time, I’m adding a mAxDoP 1 hint to it:

SELECT COUNT(*)
FROM dbo.Vetos
WHERE UserId = 138
AND   PostId = 138
AND   BountyAmount = 138
AND   VoteTypeId = 138
AND   CreationDate = 138
OPTION(MAXDOP 1);

Here’s Where Things Get Interesting


SQL Server Wait Stats
Bothsies

Our MaXdOp 1 query registers nearly the same amount of time on stats updates and parallelism.

SQL Server Query Plan
If this is madness…

But our plan is indeed serial. Because we told it to be.

By setting maxDOP to 1.

Not Alone


So, if you’re out there in the world wondering why this crazy kinda thing goes down, here’s one explanation.

Are there others? Probably.

But you’ll have to find out by setting MAXdop to 1 on your own.

Thanks for reading!

Going Further


If this is the kind of SQL Server stuff you love learning about, you’ll love my training. I’m offering a 75% discount to my blog readers if you click from here. I’m also available for consulting if you just don’t have time for that and need to solve performance problems quickly.

Thoughts On Setting MAXDOP Correctly In SQL Server

Microsoft recently published new guidance on setting server level MAXDOP. I hope to help the community by analyzing the new guidance and offering some of my own thoughts on query parallelism.

Line by line


Documentation is meant to be shared after all, so hopefully no one minds if I quote most of it:

Starting with SQL Server 2016 (13.x), during service startup if the Database Engine detects more than eight physical cores per NUMA node or socket at startup, soft-NUMA nodes are created automatically by default. The Database Engine places logical processors from the same physical core into different soft-NUMA nodes.

This is true and one of the bigger benefits of auto soft-NUMA as far as I’ve been able to tell.

The recommendations in the table below are aimed at keeping all the worker threads of a parallel query within the same soft-NUMA node.

SQL Server is not designed to keep all worker threads in a single soft-NUMA node. That might have been true in SQL Server 2008, but it changed in 2012. The only semi-official documentation that I know of is here and I looked into the behavior here. Read through both if you’re interested in how scheduling of parallel worker threads is performed by SQL Server, but I’ll provide a quick summary via example here.

Suppose you have two soft-NUMA nodes of 6 schedulers each and the server just restarted.NUMA node 0 has positions 0-5 and NUMA node 1 has positions 6-11. The global enumerator starts at position 0. If I run a MAXDOP 4 query then the enumerator advances by 4. The parallel workers are allowed in positions 0-3 which means that any four out of six schedulers can be chosen from NUMA node 0. All parallel worker threads are in NUMA node 0 for the first query. Suppose I run another MAXDOP 4 query. The enumerator advances by 4 and the allowed positions are 4-7. That means that any two schedulers can be chosen from NUMA node 0 and any two schedulers can be chosen from NUMA node 1. The worker threads are split over two soft-NUMA nodes even though query MAXDOP is less than the size of the soft-NUMA nodes.

Unless you’re on a server with a single soft-NUMA node it is difficult to guarantee that all worker threads end up on the same soft-NUMA node. I strongly recommend against aiming for that as a goal. There are more details in the “Preventing hard NUMA worker splits” section of this blog post.

This will improve the performance of the queries and distribution of worker threads across the NUMA nodes for the workload. For more information, see Soft-NUMA.

I’ve heard some folks claim that keeping all parallel workers on a single hard NUMA nodes can be important for query performance. I’ve even seen some queries experience reduced performance when thread 0 is on a different hard NUMA node than parallel worker threads. I haven’t heard of anything about the importance of keeping all of a query’s worker threads on a single soft-NUMA node. It doesn’t really make sense to say that query performance will be improved if all worker threads are on the same soft-NUMA node. Soft-NUMA is a configuration setting. Suppose I have a 24 core hard NUMA node and my goal is to get all of a parallel query’s worker threads on a single soft-NUMA node. To accomplish that goal the best strategy is to disable auto soft-NUMA because that will give me a NUMA node size of 24 as opposed to 8. So disabling auto soft-NUMA will increase query performance?

Starting with SQL Server 2016 (13.x), use the following guidelines when you configure the max degree of parallelism server configuration value:

Server with single NUMA node [and] Less than or equal to 8 logical processors: Keep MAXDOP at or below # of logical processors

I don’t understand this guidance at all. If MAXDOP is set to above the number of logical processors then the total number of logical processors is used. This is even mentioned earlier on the same page of documentation. This line is functionally equivalent to “Set MAXDOP to whatever you want”.

Server with single NUMA node [and] Greater than 8 logical processors: Keep MAXDOP at 8

This configuration is only possible with a physical core count between 5 and 8 and with hyperthreading enabled. Setting MAXDOP above the physical core count isn’t recommended by some folks, but I suppose there could be some scenarios where it makes sense. Keeping MAXDOP at 8 isn’t bad advice for many queries on a large enough server, but the documentation is only talking about small servers here.

Server with multiple NUMA nodes [and] Less than or equal to 16 logical processors per NUMA node: Keep MAXDOP at or below # of logical processors per NUMA node

I have never seen an automatic soft-NUMA configuration result in more than 16 schedulers per soft-NUMA node, so this covers all server configurations with more than 8 physical cores. Soft-NUMA scheduler counts per node can range from 4 to 16. If you accept this advice then in some scenarios you’ll need to lower MAXDOP as you increase the number of physical cores per socket. For example, if I have 24 schedulers per socket without hyperthreading then auto soft-NUMA gives me three NUMA nodes of 8 schedulers, so I might set MAXDOP to 8. But if the scheduler count is increased to 25, 26, or 27 then I’ll have at least one soft-NUMA node of 6 schedulers. So I should lower MAXDOP from 8 to 6 because the physical core count of the socket increased?

Server with multiple NUMA nodes [and] Greater than 16 logical processors per NUMA node: Keep MAXDOP at half the number of logical processors per NUMA node with a MAX value of 16

I have never seen an automatic soft-NUMA configuration result in more than 16 schedulers per soft-NUMA node. I believe that this is impossible. At the very least, if it possible I can tell you that it’s rare. This feels like an error in the documentation. Perhaps they were going for some kind of hyperthreading adjustment?

NUMA node in the above table refers to soft-NUMA nodes automatically created by SQL Server 2016 (13.x) and higher versions.

I suspect that this is a mistake and that some “NUMA node” references are supposed to refer to hard NUMA. It’s difficult to tell.

Use these same guidelines when you set the max degree of parallelism option for Resource Governor workload groups.

There are two benefits to using MAXDOP at the Resource Governor workload group level. The first benefit is that it allows different workloads to have different MAXDOP without changing lots of application code. The guidance here doesn’t allow for that benefit. The second benefit is that it acts as a hard limit on query MAXDOP as opposed to the soft limit provided with server level MAXDOP. It may also be useful to know that the query optimizer takes server level MAXDOP into account when creating a plan. It does not do so for MAXDOP set via Resource Governor.

I haven’t seen enough different types of workloads in action to provide generic MAXDOP guidance, but I can share some of the issues that can occur with query parallelism being too low or too high.

What are some of the problems with setting MAXDOP too low?


  1. Better query performance may be achieved with a higher MAXDOP. For example, a well-written MAXDOP 8 query on a quiet server may simply run eight times as quickly as the MAXDOP 1 version. In some scenarios this is highly desired behavior.
  2. There may not be enough concurrent queries to get full value out of the server’s hardware without increasing query MAXDOP. Unused schedulers can be a problem for batch workloads that aim to get a large, fixed amount of work done as quickly as possible.
  3. Row mode bitmap operators associated with hash joins and merge joins only execute in parallel plans. MAXDOP 1 query plans lose out on this optimization.

What are some of the problems with setting MAXDOP too high?


  1. At some point, throwing more and more parallel queries at a server will only slow things down. Imagine adding more and more cars to an already gridlocked traffic situation. Depending on the workload you may not want to have many active workers per scheduler.
  2. It is possible to run out of worker threads with many concurrent parallel queries that have many parallel branches each. For example, a MAXDOP 8 query with 20 branches will ask for 160 parallel workers. When this happens parallel queries can get downgraded all the way to MAXDOP 1.
  3. Row mode exchange operators need to move rows between threads and do not scale well with increased query MAXDOP.
  4. Some types of row mode exchange operators evenly divide work among all parallel worker threads. This can degrade query performance if even one worker thread is on a busy scheduler. Consider a server with 8 schedulers. Scheduler 0 has two active workers and all other schedulers have no workers. Suppose there is 40 seconds of CPU work to do, the query scales with MAXDOP perfectly, and work is evenly distributed to worker threads. A MAXDOP 4 query can be expected to run in 40/4 = 10 seconds since SQL Server is likely to pick four of the seven less busy schedulers. However, a MAXDOP 8 query must put one of the worker threads on scheduler 0. The work on schedulers 1 – 7 will finish in 40/8 = 5 seconds but the worker thread on scheduler 0 has to yield to the other worker threads. It may take 5 * 3 = 15 seconds if CPU is shared evenly, so in this example increasing MAXDOP from 4 to 8 increases query run time from 10 seconds to 15 seconds.
  5. The query memory grant for parallel inserts into columnstore indexes increases with MAXDOP. If MAXDOP is too high then memory pressure can occur during compression and the SELECT part of the query may be starved for memory.
  6. The query memory grant for memory-consuming operators on the inner side of a nested loop is often not increased with MAXDOP even though the operator may execute concurrently once on each worker thread. In some uncommon query patterns, increasing MAXDOP will increase the amount of data spilled to tempdb.
  7. Increasing MAXDOP increases the number of queries that will have parallel workers spread across multiple hard NUMA nodes. If MAXDOP is greater than the number of schedulers in a hard NUMA node then the query is guaranteed to have split workers. This can degrade query performance for some types of queries.
  8. Worker threads may need to wait on some type of shared resource. Increasing MAXDOP can increase contention without improving query performance. For example, there’s nothing stopping me from running a MAXDOP 100 SELECT INTO, but I certainly do not get 100X of the performance of a MAXDOP 1 query. The problem with the below query is the NESTING_TRANSACTION_FULL latch:

SQL Server Query Plan Properties

Preventing hard NUMA worker splits


It generally isn’t possible to prevent worker splits over hard NUMA nodes without changing more than server level and query level MAXDOP. Consider a server with 2 hard NUMA nodes of 10 schedulers for each. To avoid a worker split, an administrator might try setting server level MAXDOP to 10, with the idea being that each parallel query spreads its workers over NUMA node 0 or NUMA node 1. This plan won’t work if any of the following occur:

  • Any query runs with a query level MAXDOP hint other than 0, 1, 10, or 20.
  • Any query is downgraded in MAXDOP but still runs in parallel.
  • A parallel stats update happens. The last time I checked these run with a query level MAXDOP hint of 16.
  • Something else unexpected happens.

In all cases the enumerator will be shifted and any MAXDOP 10 queries that run after will split their workers. TF 2467 can help, but it needs to be carefully tested with the workload. With the trace flag, as long as MAXDOP <= 10 and automatic soft-NUMA is disabled then the parallel workers will be sent to a single NUMA node based on load. Note that execution context 0 thread can still be on a different hard NUMA node. If you want to prevent that then you can try Resource Governor CPU affinity at the Resource Pool level. Create one pool for NUMA node 0 and one pool for NUMA node 1. You may experience interesting consequences when doing that.

The most reliable method by far is to have a single hard NUMA node, so if you have a VM that fits into a single socket of a VM host and you care about performance then ask your friendly VM administrator for some special treatment.

Final thoughts


I acknowledge that it’s difficult to create MAXDOP guidance that works for all scenarios and I hope that Microsoft continues to try to improve their documentation on the subject. Thanks for reading!

Video: Is Setting MAXDOP and Cost Threshold for Parallelism Really Easy?

Asked and Answered


Thanks for watching!

Going Further


If this is the kind of SQL Server stuff you love learning about, you’ll love my training. I’m offering a 75% discount to my blog readers if you click from here. I’m also available for consulting if you just don’t have time for that and need to solve performance problems quickly.