How SQL Server’s Query Plan Cache Lies: Triggers

Simpler Times


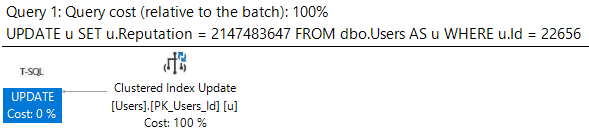
Let’s say we’ve got a simple update query. When we run it, it finishes instantly, and the query plan has no surprises.

BEGIN TRAN
UPDATE u
SET u.Reputation = 2147483647
FROM dbo.Users AS u
WHERE u.Id = 22656;

ROLLBACK
SQL Server Query Plan
One to the two

Then one day DevOps comes along and says that every time Reputation gets updated in the Users table, we have to check a bunch of conditions and then do a bunch of stuff based on the value.

One of those checks is to see if anyone has the ?INT MAX? and then insert a row into Badges.

Because I’m lazy (Agile?), I’m going to stick a waitfor in the trigger to simulate all the other checks and actions.

CREATE OR ALTER TRIGGER dbo.one_time
ON dbo.Users
AFTER UPDATE
AS
BEGIN
    
    IF EXISTS ( SELECT 1/0 
                FROM Inserted 
                WHERE Inserted.Reputation = 2147483647 )

    INSERT dbo.Badges ( Name, UserId, Date )
    SELECT N'INT MAX OMG', Id, GETDATE()
    FROM Inserted

    WAITFOR DELAY '00:00:10.000'

END;
GO

Less Simpler Times


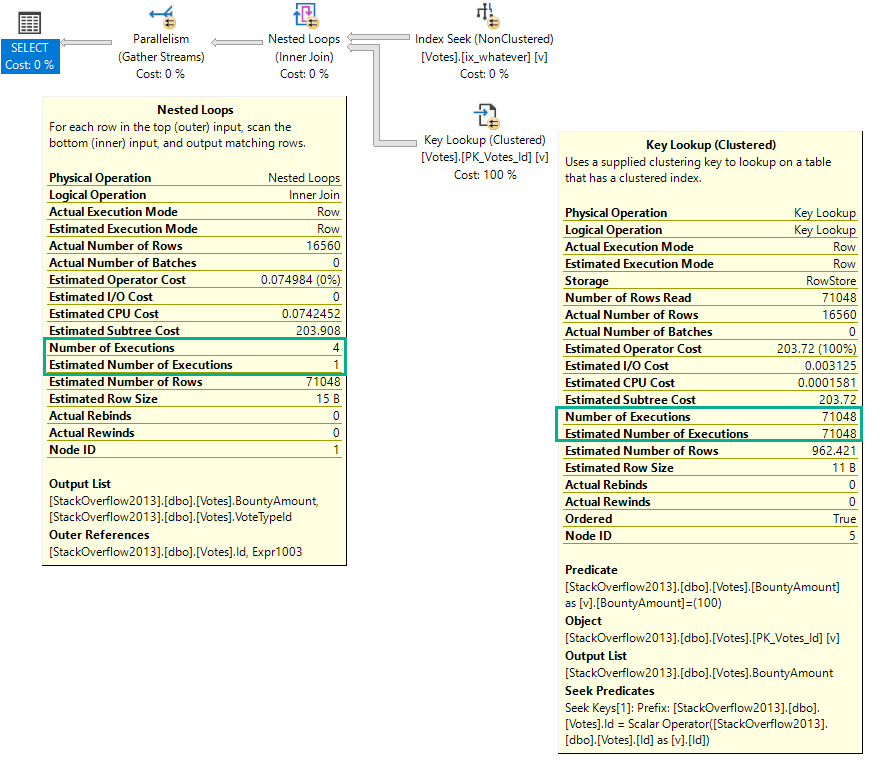
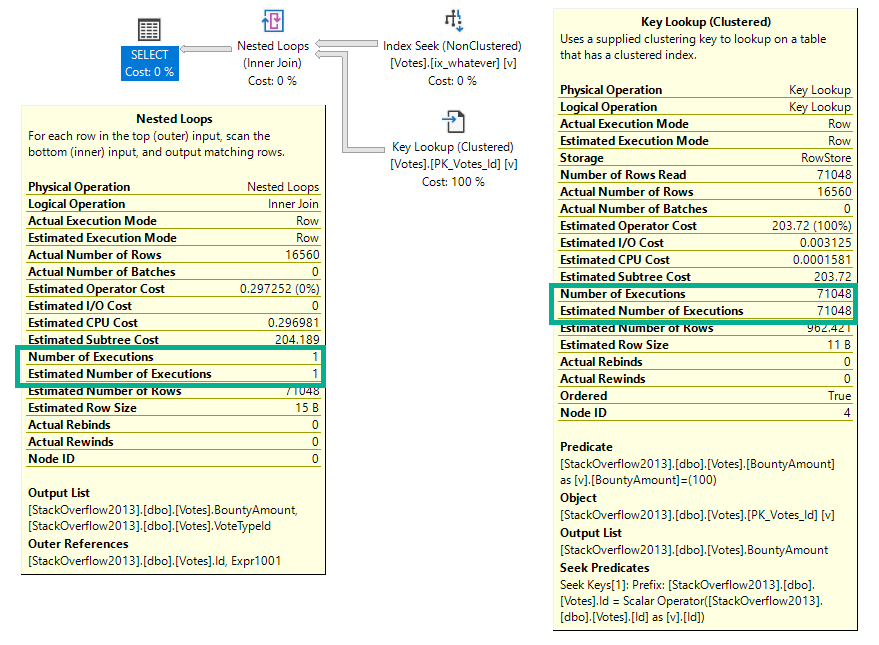
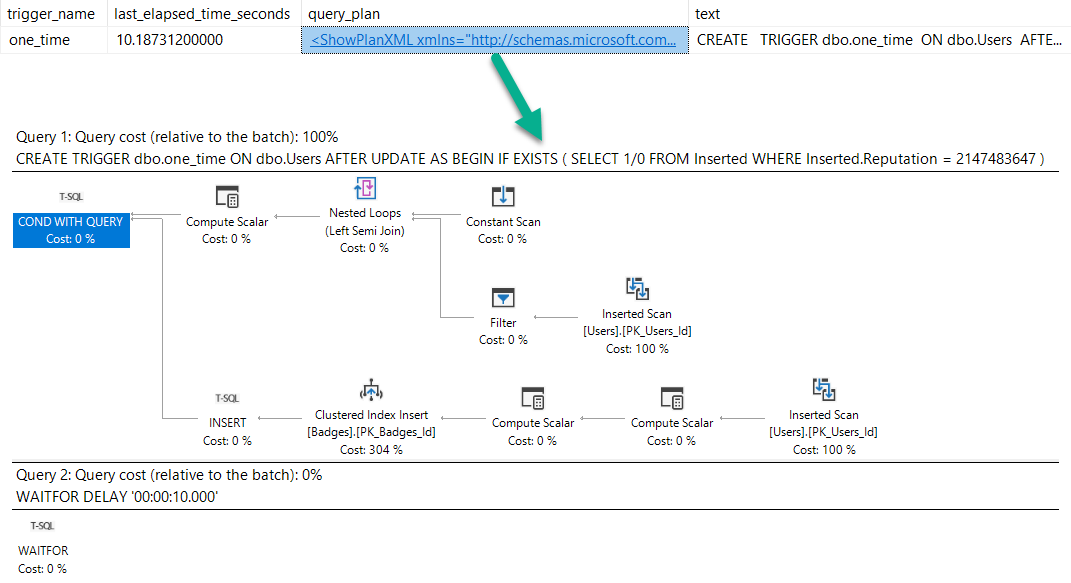
Now when we run our update, the plan looks like this.

SQL Server Query Plan
Ass-mar

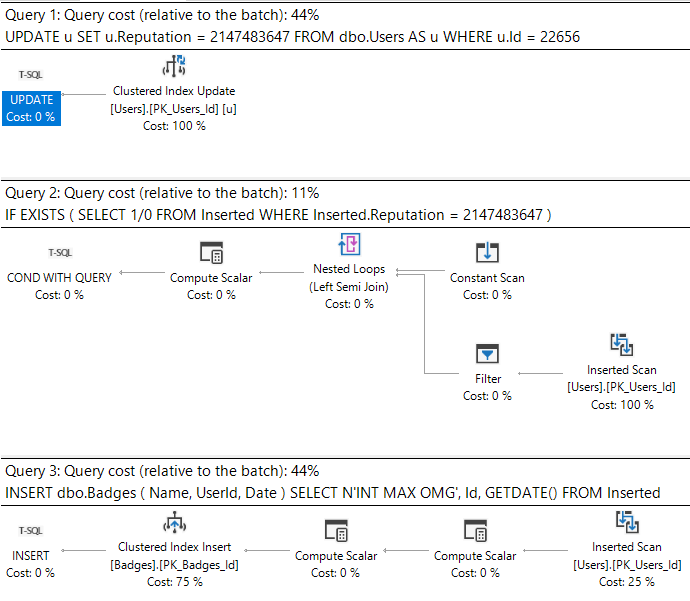
What’s important here is that we can see the work associated with the triggers.

What sucks is when we look at the plan cache.

Back To Easy


I’m gonna stick that update in a stored procedure to make life a little easier when we go looking for it.

CREATE PROCEDURE dbo.update_reputation 
AS
BEGIN
    BEGIN TRAN
    UPDATE u
    SET u.Reputation = 2147483647
    FROM dbo.Users AS u
    WHERE u.Id = 22656;
    
    ROLLBACK    
END;

After running the proc, here’s what we get back from the plan cache.

    SELECT OBJECT_NAME(deps.object_id) AS proc_name, 
           deps.last_elapsed_time / 1000. / 1000. AS last_elapsed_time_seconds,
           deqp.query_plan,
           dest.text
    FROM sys.dm_exec_procedure_stats AS deps
    CROSS APPLY sys.dm_exec_query_plan(deps.plan_handle) AS deqp
    CROSS APPLY sys.dm_exec_sql_text(deps.plan_handle) AS dest
    WHERE deps.object_id = OBJECT_ID('dbo.update_reputation');
SQL Server Query Plan
Investigative Reports

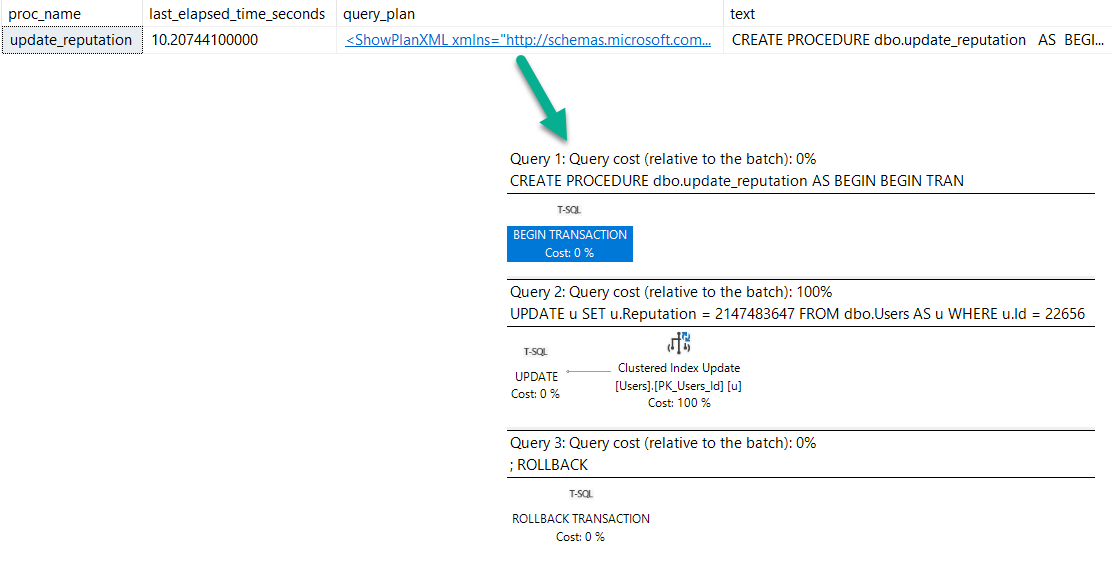
We have a procedure reporting that it ran for 10 seconds (which it did, sort of…).

But no mention of the trigger. Hm.

Of course, we can get this information from trigger stats, but we’d have to know to go looking:

    SELECT OBJECT_NAME(object_id) AS trigger_name,
           dets.last_elapsed_time / 1000. / 1000. AS last_elapsed_time_seconds,
           deqp.query_plan,
           dest.text
    FROM sys.dm_exec_trigger_stats AS dets
    CROSS APPLY sys.dm_exec_query_plan(dets.plan_handle) AS deqp
    CROSS APPLY sys.dm_exec_sql_text(dets.plan_handle) AS dest
    WHERE OBJECT_ID = OBJECT_ID('dbo.one_time');
SQL Server Query Plan
Get busy

Lying Liars


When seemingly simple modification queries take a long time, things may not be as simple as they appear.

Blocking, and triggers might be at play. Unfortunately, there’s not a great way of linking any of that together right now.

Thanks for reading!

Going Further


If this is the kind of SQL Server stuff you love learning about, you’ll love my training. I’m offering a 75% discount to my blog readers if you click from here. I’m also available for consulting if you just don’t have time for that and need to solve performance problems quickly.

SQL Server Query Plan Operators That Hide Performance Problems

In A Row?


When you’re reading query plans, you can be faced with an overwhelming amount of information, and some of it is only circumstantially helpful.

Sometimes when I’m explaining query plans to people, I feel like a mechanic (not a Machanic) who just knows where to go when the engine makes a particular rattling noise.

That’s not the worst thing. If you know what to do when you hear the rattle next time, you learned something.

One particular source of what can be a nasty rattle is query plan operators that execute a lot.

Busy Killer Bees


I’m going to talk about my favorite example, because it can cause a lot of confusion, and can hide a lot of the work it’s doing behind what appears to be a friendly little operator.

Something to keep in mind is that I’m looking at the actual plans. If you’re looking at estimated/cached plans, the information you get back may be inaccurate, or may only be accurate for the cached version of the plan. A query plan reused by with parameters that require a different amount of work may have very different numbers.

Nested Loops


Let’s look at a Key Lookup example, because it’s easy to consume.

CREATE INDEX ix_whatever ON dbo.Votes(VoteTypeId);

SELECT v.VoteTypeId, v.BountyAmount
FROM dbo.Votes AS v
WHERE v.VoteTypeId = 8
AND v.BountyAmount = 100;

You’d think with “loops” in the name, you’d see the number of executions of the operator be the number of loops SQL Server thinks it’ll perform.

But alas, we don’t see that.

In a parallel plan, you may see the number of executions equal to the number of threads the query uses for the branch that the Nested Loops join executes in.

For instance, the above query runs at MAXDOP four, and coincidentally uses four threads for the parallel nested loops join. That’s because with parallel nested loops, each thread executes a serial version of the join independently. With stuff like a parallel scan, threads work more cooperatively.

SQL Server Query Plan
Too Much Speed

If we re-run the same query at MAXDOP 1, the number of executions drops to 1 for the nested loops operator, but remains at 71,048 for the key lookup.

SQL Server Query Plan
Beat Feet

But here we are at the very point! It’s the child operators of the nested loops join that show how many executions there were, not the nested loops join itself.

Weird, right?

Thanks for reading!

Going Further


If this is the kind of SQL Server stuff you love learning about, you’ll love my training. I’m offering a 75% discount to my blog readers if you click from here. I’m also available for consulting if you just don’t have time for that and need to solve performance problems quickly.