Does My SQL Server Need More Memory?

Work It


Memory is S-Tier crucial for most workloads to run reliably fast. It’s where SQL Server caches data pages, and it’s what it gives to queries to process Sorts and Hashes (among other things, but these are most common).

Without it, those two things, and many other caches, would be forced to live on disk. Horrible, slow disk. Talk about a good way to make databases less popular, eh?

With no offense to the SAN administrators of the world, I consider it my sworn duty to have databases avoid your domain as much as possible.

In this post, we’ll talk about how to figure out if your SQL Server needs more memory, and if there’s anything you can do to make better use of memory at the same time.

After all, you could be doing just fine.

(You’re probably not.)

Tale Of The Wait Stats


You can look at wait stats related to memory and query performance by running sp_PressureDetector.

It’ll give you some details about wait stats that relate to CPU and memory pressure. You wanna pay attention to the memory and disk waits, here. I had to squish it a little, but if you’re unfamiliar you can use the “description” column to better understand which ones to pay attention to.

SQL Server Wait Stats

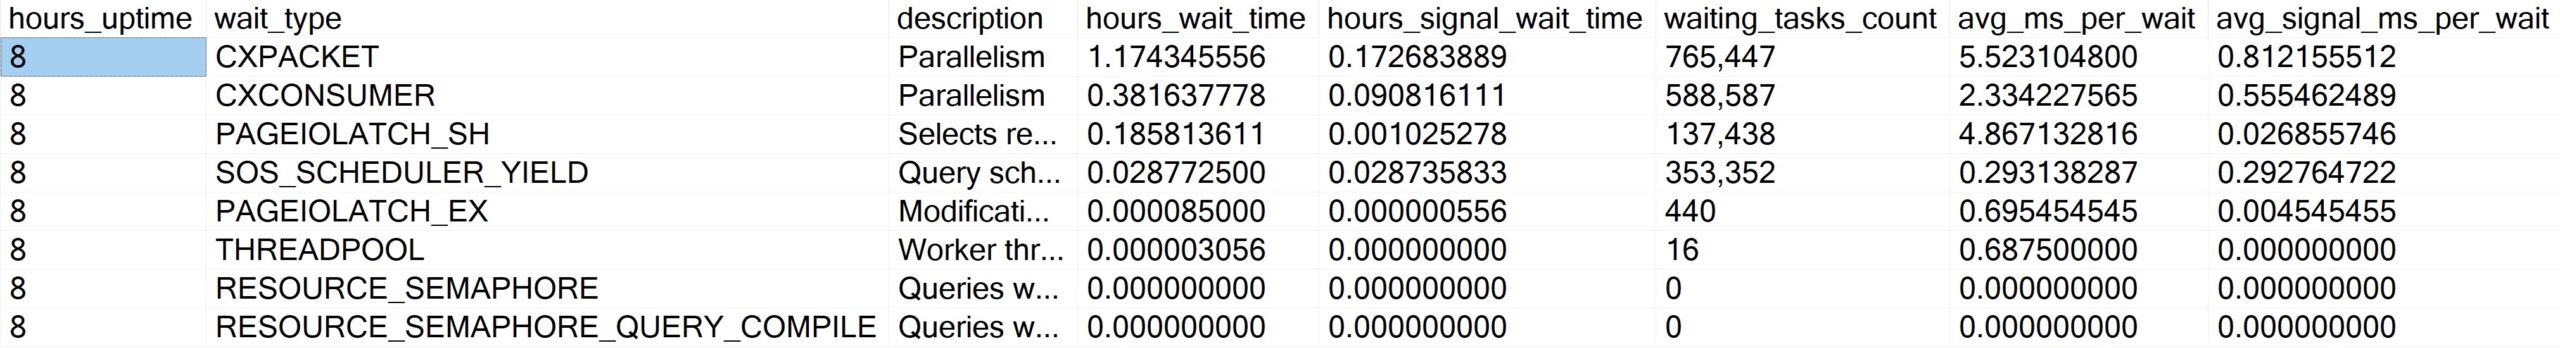
Some important metrics to note here:

  • How do wait times relate to server uptime?
  • How long on average do we wait on each of these?

This won’t tell the whole story, of course, but it is a reasonable data point to start with. If your workload isn’t a 24×7 slog, though, you might need to spend more time analyzing waits for queries as they run.

In this example, it’s my local SQL instance, so it hasn’t been doing much work since I restarted it. Sometimes, you gotta look at what queries that are currently running are waiting on.

For that, go grab sp_WhoIsActive. If you see queries constantly waiting on stuff like this, it might be a sign you need more memory, because you have to keep going out to disk to get what queries need to use.

SQL Server Wait Stats
telling myself

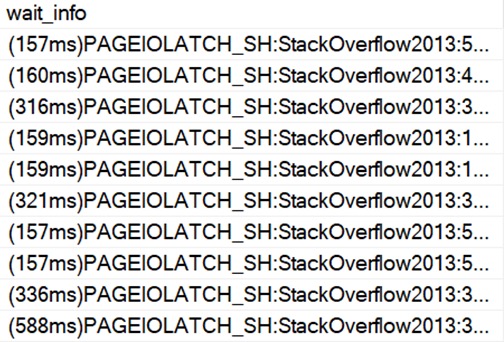
It could also be a sign of other things, like queries and indexes that need tuning, but if it’s sustained like this then that’s not entirely likely.

It’s much more likely a memory deficiency, but it’s up to you to investigate further on your system.

How Is SQL Server Using Memory Now?


Current memory utilization can be a good way to find out if other things are using memory and taking valuable space away from your buffer pool.

A lot of folks out there don’t realize how many different things SQL Server has to share memory across.

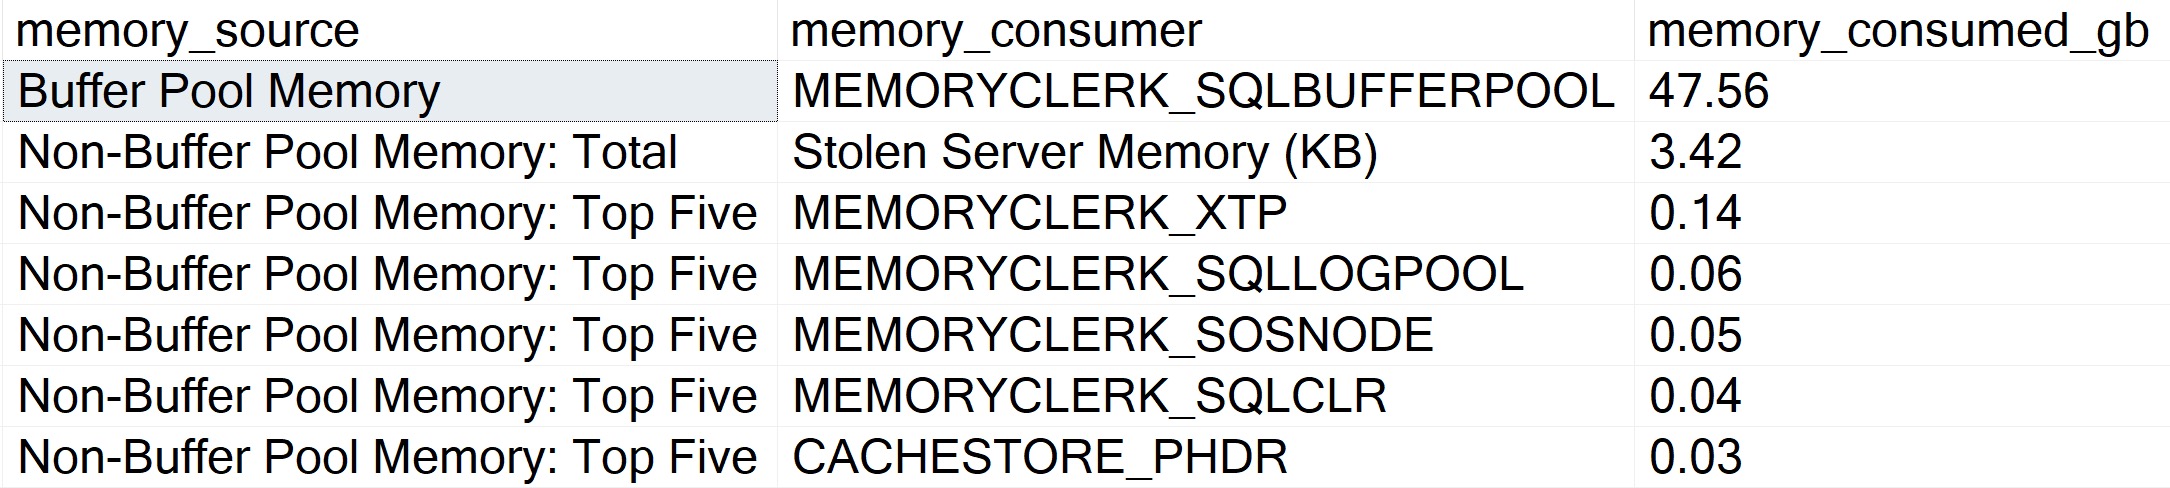
And, hey, yeah, sp_PressureDetector will show you that, too. Here’s a “normal” run:

SQL Server’s buffer pool is uninfringed upon by other consumers! Great. But sometimes queries ask for memory grants, and that’s where things can get perilous.

SQL Server Memory Clerks
i feel good

You may sometimes see Ye Olde First Memory Bank Of Motherboard loan out a swath to one or more queries:

SQL Server Memory Clerks
dramarama

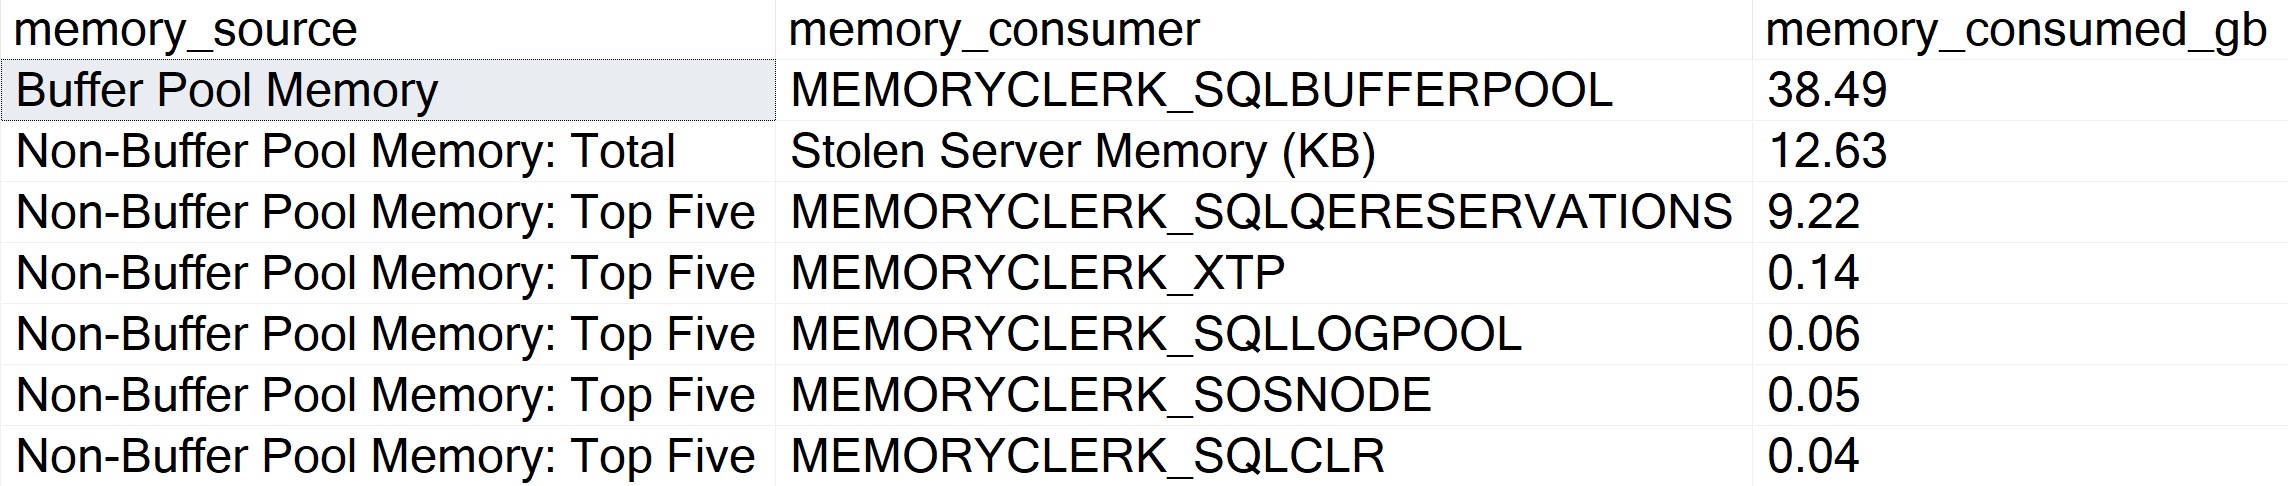
The difference here? The buffer pool is reduced by ~9GB to accommodate a query memory grant.

sp_PressureDetector will show you the queries doing that, too, along with query plans.

sp_WhoIsActive
everyone is gone

It’ll also show you memory available in resource pools for granting out to queries. On this server, Max Server Memory is set to 50GB.

If you’re shocked that SQL Server is willing to give out 37GB of that to query memory grants, you haven’t been hanging around SQL Server long enough.

And you wonder why I worry about memory!

Does SQL Server Need More Memory?


If your queries are constantly waiting on:

  • Reading pages from disk (PAGEIOLATCH_…)
  • Query memory grants (RESOURCE_SEMAPHORE)
  • Compiling query plans (RESOURCE_SEMAPHORE_QUERY_COMPILE)

Then there’s a pretty good chance that it does, especially if data just plain outpaces memory by a good margin (like 3:1 or 4:1 or more).

You also have some options for making better use of your current memory, too.

  • Check critical queries for indexing opportunities  (there may not always be a missing index request, but seasoned query tuners can spot ones the optimizer doesn’t)
  • Apply PAGE compression to existing row store indexes to make them smaller on disk and in memory
  • Check the plan cache for queries asking for large memory grants, but not using all of what’s granted to them

You can check the plan cache using a query like this. It’ll look for queries that ask for over 5GB of memory, and don’t use over 1GB of it.

WITH 
    unused AS
(
    SELECT TOP (100)
        oldest_plan = 
            MIN(deqs.creation_time) OVER(),
        newest_plan = 
            MAX(deqs.creation_time) OVER(),
        deqs.statement_start_offset,
        deqs.statement_end_offset,
        deqs.plan_handle,
        deqs.execution_count,
        deqs.max_grant_kb,
        deqs.max_used_grant_kb,
        unused_grant = 
            deqs.max_grant_kb - deqs.max_used_grant_kb,
        deqs.min_spills,
        deqs.max_spills
    FROM sys.dm_exec_query_stats AS deqs
    WHERE (deqs.max_grant_kb - deqs.max_used_grant_kb) > 1024.
    AND   deqs.max_grant_kb > 5242880.
    ORDER BY unused_grant DESC
)
SELECT      
    plan_cache_age_hours = 
        DATEDIFF
        (
            HOUR,
            u.oldest_plan,
            u.newest_plan
        ),
    query_text = 
        (
            SELECT [processing-instruction(query)] =
                SUBSTRING
                (
                    dest.text, 
                    ( u.statement_start_offset / 2 ) + 1,
                    (
                        ( 
                            CASE u.statement_end_offset 
                                 WHEN -1 
                                 THEN DATALENGTH(dest.text) 
                                 ELSE u.statement_end_offset 
                            END - u.statement_start_offset 
                        ) / 2 
                    ) + 1
                )
                FOR XML PATH(''), 
                    TYPE
        ),
    deqp.query_plan,
    u.execution_count,
    u.max_grant_kb,
    u.max_used_grant_kb,
    u.min_spills,
    u.max_spills,
    u.unused_grant
FROM unused AS u
OUTER APPLY sys.dm_exec_sql_text(u.plan_handle) AS dest
OUTER APPLY sys.dm_exec_query_plan(u.plan_handle) AS deqp
ORDER BY u.unused_grant DESC
OPTION (RECOMPILE, MAXDOP 1);

This will get you the top (up to!) 100 plans in the cache that have an unused memory grant, ordered by the largest difference between grant and usage.

What you wanna pay attention to here:

  • How old the plan cache is: if it’s not very old, you’re not getting the full picture
  • How big the memory grants are: by default, the max is ~25% of max server memory

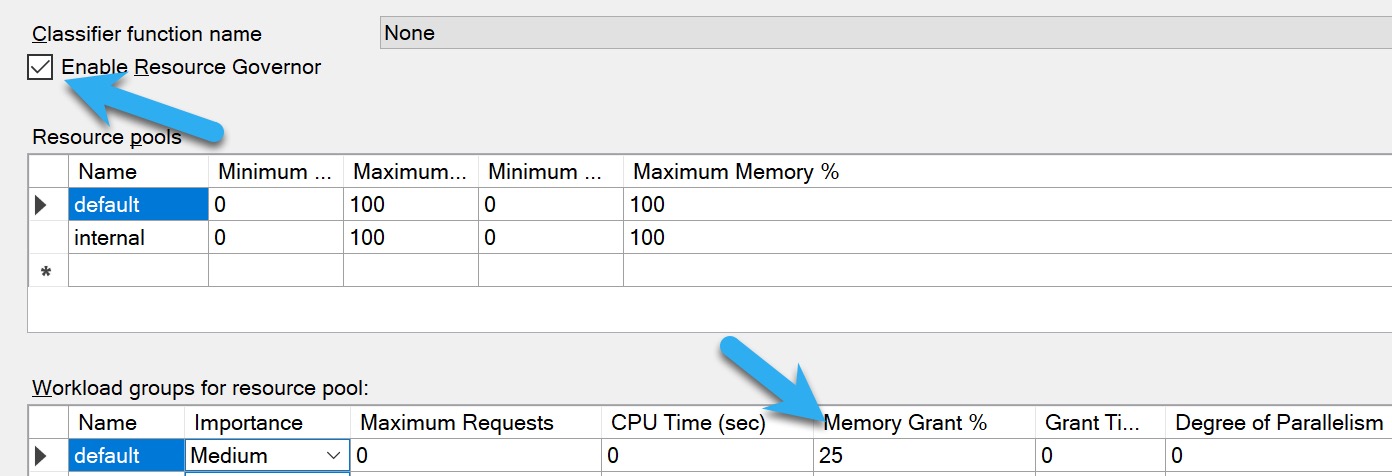
Controlling Memory Grants


If you’re looking for ways to control memory grants that doesn’t involved a bunch of query and index tuning, you have a few options:

  • Resource Governor: Enterprise Edition only, and usually applies to the whole workload
  • MIN_GRANT_PERCENT and MAX_GRANT_PERCENT query hints: You usually wanna use both to set a proper memory grant, just setting an upper level isn’t always helpful
  • Batch Mode Memory Grant Feedback: Requires Batch Mode/Columnstore, only helps queries between executions, usually takes a few tries to get right

For Resource Governor, you’ll wanna do some analysis using the query in the previous section to see what a generally safe upper limit for memory grants is. The more memory you have, and the higher your max server memory is, the more insane 25% is.

SQL Server Resource Governor
signs and numbers

Again, just be cautious here. If you change this setting based on a not-very-old plan cache, you’re not gonna have a clear pictures of which queries use memory, and how much they use. If you’re wondering why I’m not telling you to use Query Store for this, it’s because it only logs how much memory queries used, not how much they asked for. It’s pretty ridiculous.

After you make a change like this, or start using those query hints, you’ll wanna do some additional analysis to figure out if queries are spilling to disk. You can change the query above to something like this to look at those:

WITH 
    unused AS
(
    SELECT TOP (100)
        oldest_plan = 
            MIN(deqs.creation_time) OVER(),
        newest_plan = 
            MAX(deqs.creation_time) OVER(),
        deqs.statement_start_offset,
        deqs.statement_end_offset,
        deqs.plan_handle,
        deqs.execution_count,
        deqs.max_grant_kb,
        deqs.max_used_grant_kb,
        unused_grant = 
            deqs.max_grant_kb - deqs.max_used_grant_kb,
        deqs.min_spills,
        deqs.max_spills
    FROM sys.dm_exec_query_stats AS deqs
    WHERE deqs.min_spills > (128. * 1024.) 
    ORDER BY deqs.max_spills DESC
)
SELECT      
    plan_cache_age_hours = 
        DATEDIFF
        (
            HOUR,
            u.oldest_plan,
            u.newest_plan
        ),
    query_text = 
        (
            SELECT [processing-instruction(query)] =
                SUBSTRING
                (
                    dest.text, 
                    ( u.statement_start_offset / 2 ) + 1,
                    (
                        ( 
                            CASE u.statement_end_offset 
                                 WHEN -1 
                                 THEN DATALENGTH(dest.text) 
                                 ELSE u.statement_end_offset 
                            END - u.statement_start_offset 
                        ) / 2 
                    ) + 1
                )
                FOR XML PATH(''), 
                    TYPE
        ),
    deqp.query_plan,
    u.execution_count,
    u.max_grant_kb,
    u.max_used_grant_kb,
    u.min_spills,
    u.max_spills,
    u.unused_grant
FROM unused AS u
OUTER APPLY sys.dm_exec_sql_text(u.plan_handle) AS dest
OUTER APPLY sys.dm_exec_query_plan(u.plan_handle) AS deqp
ORDER BY u.max_spills DESC
OPTION (RECOMPILE, MAXDOP 1);

Small spills aren’t a big deal here, but you’ll definitely wanna pay attention to larger ones. This is set to find ones that are over 1GB, which is still pretty small, but could be meaningful.

If you notice a lot more queries spilling in a substantial way, you may have capped the high end of query memory grants too low.

Recap


Memory is something that I see people struggle to right-size, forecast, and understand the physics of in SQL Server. The worst part is that hardly anything in this post applies to Standard Edition, which is basically dead to me.

The main things to keep an eye on are:

  • Wait stats overall, and for running queries
  • Large unused memory grants in the plan cache
  • Size of data compared to size of memory

If you need help with this sort of thing, hit the link below to drop me a line about consulting.

Thanks for reading!

Going Further


If this is the kind of SQL Server stuff you love learning about, you’ll love my training. I’m offering a 75% discount to my blog readers if you click from here. I’m also available for consulting if you just don’t have time for that and need to solve performance problems quickly.

Getting Parameter Values From A SQL Server Query Plan For Performance Tuning

Property Management


I’m a really big fan of using operator properties for a lot of things, at least visually. Where things sort of fall down for that is copying and pasting things out.

For some stuff, you still need to head down to the XML.

Let’s say you have a stored procedure that accepts a bunch of parameters. The rest of this one isn’t important, but here you go:

CREATE OR ALTER PROCEDURE 
    dbo.AwesomeSearchProcedure 
( 
    @OwnerUserId int = NULL, 
    @CreationDate datetime = NULL, 
    @LastActivityDate datetime = NULL,
    @PostTypeId int = NULL,
    @Score int = NULL,
    @Title nvarchar(250) = NULL, 
    @Body nvarchar(MAX) = NULL 
)

A Plan Appears


Let’s say we grab a query plan for this thing from the plan cache or query store. We can get the properties of the select operator and see compile time values:

EXEC dbo.AwesomeSearchProcedure 
    @OwnerUserId = 35004,
    @CreationDate = '20130101', 
    @LastActivityDate = '20140101',
    @Title = N'SQL Server';

We get this back:

SQL Server Query Plan
visio

Again — nice visually — but it doesn’t do much for us if we want to recreate executing the stored procedure to get an actual execution plan.

It’s also not terrible helpful if we want to simulate a parameter sniffing situation, because we only have the compile time values, not the run time values.

Bummer. But whatever.

XML Time!


If we right click and select “show execution plan XML”, we can scroll way down to the bottom to find the XML fragment that holds what the properties display:

<ParameterList>
  <ColumnReference Column="@iTitle" ParameterDataType="nvarchar(250)" ParameterCompiledValue="N'SQL Server'" />
  <ColumnReference Column="@iLastActivityDate" ParameterDataType="datetime" ParameterCompiledValue="'2014-01-01 00:00:00.000'" />
  <ColumnReference Column="@iCreationDate" ParameterDataType="datetime" ParameterCompiledValue="'2013-01-01 00:00:00.000'" />
  <ColumnReference Column="@iOwnerUserId" ParameterDataType="int" ParameterCompiledValue="(35004)" />
</ParameterList>

This still isn’t awesome, because we have to do some surgery on the XML itself to get values out.

It’s even worse if we have a parameterized application query, because not only do we need to make a DECLARE to assign values to these variables but we need to turn the query itself into dynamic SQL.

If we don’t do that, we’ll fall victim to a common pitfall: testing queries with local variables.

Passwords


For most things, I absolutely adore using operator properties. For some things, you still need the XML.

It’d be nice if there were some fancy copy and paste magic that would do that for you, but so far it doesn’t exist.

Thanks for reading!

Going Further


If this is the kind of SQL Server stuff you love learning about, you’ll love my training. I’m offering a 75% discount to my blog readers if you click from here. I’m also available for consulting if you just don’t have time for that and need to solve performance problems quickly.

How OPTIMIZE FOR UNKNOWN Makes Troubleshooting SQL Server Performance Problems Harder

Detained


Despite the many metric tons of blog posts warning people about this stuff, I still see many local variables and optimize for unknown hints. As a solution to parameter sniffing, it’s probably the best choice 1/1000th of the time. I still end up having to fix the other 999/1000 times, though.

In this post, I want to show you how using either optimize for unknown or local variables makes my job — and the job of anyone trying to fix this stuff — harder than it should be.

Passenger


Like most things, we’re going to start with an index:

CREATE INDEX r ON dbo.Users(Reputation);
GO 

I’m going to  have a stored procedure that uses three different ways to pass a value to a where clause:

CREATE OR ALTER PROCEDURE 
    dbo.u 
(
    @r int, 
    @u int
)
AS
BEGIN

    /* Regular parameter */
    SELECT
        c = COUNT_BIG(*)
    FROM dbo.Users AS u
    WHERE u.Reputation = @r
    AND   u.UpVotes = @u;

    /* Someone who saw someone else do it at their last job */
    DECLARE 
        @LookMom int = @r,
        @IDidItAgain int = @u;
    
    SELECT
        c = COUNT_BIG(*)
    FROM dbo.Users AS u
    WHERE u.Reputation = @LookMom
    AND   u.UpVotes = @IDidItAgain;

    /* Someone who read the blog post URL wrong */
    SELECT
        c = COUNT_BIG(*)
    FROM dbo.Users AS u
    WHERE u.Reputation = @r
    AND   u.UpVotes = @u
    OPTION(OPTIMIZE FOR UNKNOWN);

END;
GO

First Way


The best case is we run this for a small number of rows, and no one really notices. Even though we get bad guesses for the second two queries, it’s not a huge deal.

SQL Server Query Plan
hands on

When you run procs like this, SQL Server doesn’t cache the compile time values the same way it does when you use parameters. Granted, this is because it technically shouldn’t matter, but if you’re looking for a way to execute the proc again to reproduce the issue, it’s up to you to go figure out what someone did.

SQL Server Query Plan
? vs ?‍♂️

Since I’m getting the actual plans here, I get the runtime values for both, but those don’t show up in the plan cache or query store version of plans.

That’s typically a huge blind spot when you’re trying to fix performance issues of any kind, but it’s up to you to capture that stuff.

Just, you know, good luck doing it in a way that doesn’t squash performance.

Second Way


In this example, our index is only on the Reputation column, but our where clause is also on the UpVotes column.

In nearly every situations, it’s better to have your query do all the filtering it can from one index source — there are obviously exceptions — but the point here is that the optimizer doesn’t bother with a missing index request for the second two queries, only for the first one.

That doesn’t matter a toif you’re looking at the query and plan right in front of you, but if you’re also using the missing index DMVs to get some idea about how useful overall a new index might be, you’re out of luck.

SQL Server Query Plan
mattered

In this case, the optimizer doesn’t think the second two plans are costly enough to warrant anything, but it does for the first plan.

I’m not saying that queries with local variables or optimize for unknown hints always do this, or that parameterized plans will always ask for (good) indexes. There are many issues with costing and SARGability that can prevent them from showing up, including getting a trivial plan.

This is just a good example of how Doing Goofy Things™ can backfire on you.

Thanks for reading!

Going Further


If this is the kind of SQL Server stuff you love learning about, you’ll love my training. I’m offering a 75% discount to my blog readers if you click from here. I’m also available for consulting if you just don’t have time for that and need to solve performance problems quickly.

Why You Should Stop Looking At Query Costs In SQL Server

Spare No Expense


Over the years, there have been a lot of requests to get sp_BlitzCache to sort results by query cost. I understand why. It’s assumed that the optimizer is never wrong and that cost is directly associated with poor performance.

There are also rather misguided efforts to figure out parallelism settings based on plan costs. The main problem with that being that if you currently have a lot of parallel queries, all that means is that the estimated cost of the serial plan was higher than your current Cost Threshold For Parallelism setting, and the cost of the parallel plan was less than the cost of the serial plan.

If you increase Cost Threshold For Parallelism, you may very well still end up with a parallel plan, because the serial version was still more expensive. If you eventually change Cost Threshold For Parallelism to the point where some queries are no longer eligible for parallelism, you may eventually find yourself unhappy with the performance of the serial version of the query plan.

Albeit with less overall wait time on CX* doodads.

Next you’ll be complaining about all the SOS_SCHEDULER_YIELD waits you’ve got.

Insteads


Rather than look at estimated metrics, you should be looking at how queries actually perform. For most servers I look at, that means looking at queries with high average CPU time, and large memory grants. Those metrics typically represent tunable aspects of the query.

In other cases, you might look at wait stats to direct the type of queries you want to go after. Reads, writes, and executions are also valuable metrics at times.

One danger of looking at totals rather than averages is that you may find things that do a little bit of something a whole lot of times, and there’s no real way to tune the small bit of activity they generate other than to run the query less.

What’s A Cost For?


In general, I only tend to look at costs to figure out plan choices within a query, or when comparing two different plans for “the same” query.

This is where experimenting with hints to change the plan shapes and choices can show you why you got the plan you did, and what you might have to do to get the plan you want naturally.

Let’s say you want to figure out why you got a specific join type. You hint the type of join you want, and there’s a missing index request now. Adding the index gets you the plan shape you want without the hint. Everyone lived happily ever after.

Until the index got fragmented ???

Thanks for reading!

Going Further


If this is the kind of SQL Server stuff you love learning about, you’ll love my training. I’m offering a 75% discount to my blog readers if you click from here. I’m also available for consulting if you just don’t have time for that and need to solve performance problems quickly.

A Query To Help You Find Plans With Eager Index Spools In SQL Server’s Plan Cache

Yawn And Yawn


I’ve written a bunch about Eager Index Spools, and how to fix them, but I’ve always sort of left the “finding” part up to you, or pointed curious tuners to tools like sp_BlitzCache.

Recently though, I worked with a client who had Eager Index Spools so frequently that we needed to track them down specifically.

This is the plan cache query that I used to do it — they didn’t have Query Store enabled — and I wanted to share it.

WITH 
    XMLNAMESPACES 
('http://schemas.microsoft.com/sqlserver/2004/07/showplan' AS x),
    plans AS 
(
    SELECT TOP (10)
        deqs.query_plan_hash,
        sort = 
            SUM(deqs.total_worker_time / deqs.execution_count)
    FROM sys.dm_exec_cached_plans AS decp
    JOIN sys.dm_exec_query_stats AS deqs
        ON decp.plan_handle = deqs.plan_handle
    CROSS APPLY sys.dm_exec_query_plan(decp.plan_handle) AS deqp
    CROSS APPLY deqp.query_plan.nodes('//x:RelOp') AS r (c)
    WHERE  r.c.exist('//x:RelOp[@PhysicalOp="Index Spool" and @LogicalOp="Eager Spool"]') = 1
    AND    EXISTS
           (      
               SELECT 
                   1/0
               FROM sys.dm_exec_plan_attributes(decp.plan_handle) AS pa 
               WHERE pa.attribute = 'dbid'
               AND   pa.value > 4
           )   
    GROUP BY deqs.query_plan_hash
    ORDER BY sort DESC
)
SELECT
    deqp.query_plan,
    dest.text,
    avg_worker_time = 
        (deqs.total_worker_time / deqs.execution_count),
    deqs.total_worker_time,
    deqs.execution_count
FROM sys.dm_exec_cached_plans AS decp
JOIN sys.dm_exec_query_stats AS deqs
    ON decp.plan_handle = deqs.plan_handle
CROSS APPLY sys.dm_exec_query_plan(decp.plan_handle) AS deqp    
CROSS APPLY sys.dm_exec_sql_text(deqs.sql_handle) AS dest
WHERE EXISTS
(
    SELECT
        1/0
    FROM plans AS p
    WHERE p.query_plan_hash = deqs.query_plan_hash
)
ORDER BY avg_worker_time DESC
OPTION(RECOMPILE, MAXDOP 1);

It’s maybe not the prettiest thing in the world, but it got the job done.

Thanks for reading!

Going Further


If this is the kind of SQL Server stuff you love learning about, you’ll love my training. I’m offering a 75% discount to my blog readers if you click from here. I’m also available for consulting if you just don’t have time for that and need to solve performance problems quickly.

Documentation for dm_db_missing_index_group_stats_query

No, It’s New


When I was checking out early builds of SQL Server 2019, I noticed a new DMV called dm_db_missing_index_group_stats_query, that I thought was pretty cool.

It helped you tie missing index requests to the queries that requested them. Previously, that took a whole lot of heroic effort, or luck.

With this new DMV, it’s possible to combine queries that look for missing indexes with queries that look for tuning opportunities in the plan cache or in Query Store.

It seems to tie back to dm_db_missing_index_groups, on the index_group_handle column in this DMV joined to the group handle column in the new DMV.

If you’re wondering why I’m not giving you any code samples here, it’s because I’m going to get some stuff built into sp_BlitzIndex to take advantage of it, now that it’s documented.

Special thanks to William Assaf (b|t) for helping to get this done.

Thanks for reading!

Going Further


If this is the kind of SQL Server stuff you love learning about, you’ll love my training. I’m offering a 75% discount to my blog readers if you click from here. I’m also available for consulting if you just don’t have time for that and need to solve performance problems quickly.

Troubleshooting RESOURCE_SEMAPHORE_QUERY_COMPILE Waits In SQL Server

Unfortunate


RESOURCE_SEMAPHORE_QUERY_COMPILE happens, in a nutshell, when SQL Server has allocated all the memory it’s willing to give out to compile query plans of a certain size and, throttles itself by making other queries wait to compile. For more details, head over here.

Now, this of course gets easier if you’re using Query Store. You can get heaps of information about query compilation from query_store_query. For everyone else, you’re left dipping into the plan cache to try to find queries with “high” compile memory. That can be hit or miss, of course.

But if it’s something you really find yourself needing to track down, here’s one way to do it:

WITH XMLNAMESPACES('http://schemas.microsoft.com/sqlserver/2004/07/showplan' AS p)
SELECT TOP (10) 
    x.compile_time_ms,
    x.compile_cpu_ms,
    x.compile_memory_kb,
    x.max_compile_memory_kb,
    x.is_memory_exceeded,
    x.query_plan
FROM
(
    SELECT
        c.x.value('@CompileTime', 'BIGINT') AS compile_time_ms,
        c.x.value('@CompileCPU', 'BIGINT') AS compile_cpu_ms,
        c.x.value('@CompileMemory', 'BIGINT') AS compile_memory_kb,
        c.x.value('(//p:OptimizerHardwareDependentProperties/@MaxCompileMemory)[1]', 'BIGINT') AS max_compile_memory_kb,
        c.x.exist('//p:StmtSimple/@StatementOptmEarlyAbortReason[.="MemoryLimitExceeded"]') AS is_memory_exceeded,
        deqp.query_plan
    FROM sys.dm_exec_cached_plans AS decp
    CROSS APPLY sys.dm_exec_query_plan(decp.plan_handle) AS deqp
    CROSS APPLY deqp.query_plan.nodes('/p:ShowPlanXML/p:BatchSequence/p:Batch/p:Statements/p:StmtSimple/p:QueryPlan') AS c(x)
    WHERE c.x.exist('@CompileMemory[. > 5120]') = 1
) AS x
ORDER BY x.compile_memory_kb DESC;

This query is filtering for plans with compile memory over 5MB. I set the bar pretty low there, but feel free to raise it up.

If you want to look at gateway info, and you’re on SQL Server 2016 or newer, you can use this DMV:

SELECT *
FROM sys.dm_exec_query_optimizer_memory_gateways AS deqomg
WHERE deqomg.pool_id > 1;

Scoping It Out


It only makes sense to run that query if you’re hitting RESOURCE_SEMAPHORE_QUERY_COMPILE wait with some frequency.

If you are, you just may be lucky enough to find the culprit, if your plan cache has been around long enough.

Thanks for reading!

Going Further


If this is the kind of SQL Server stuff you love learning about, you’ll love my training. I’m offering a 75% discount to my blog readers if you click from here. I’m also available for consulting if you just don’t have time for that and need to solve performance problems quickly.

Join Me At Data Platform Summit 2020!

The Road From Nowhere


This year, I’m teaching an 8 hour online workshop at Data Platform Summit, and I’d love it if you joined me.

Here’s what I’ll be teaching:

Class Title: The Beginner’s Guide To Advanced Performance Tuning

Abstract: You’re new to SQL Server, and your job more and more is to fix performance problems, but you don’t know where to start.

You’ve been looking at queries, and query plans, and puzzling over indexes for a year or two, but it’s still not making a lot of sense.

Beyond that, you’re not even sure how to measure if your changes are working or even the right thing to do.

In this full day performance tuning extravaganza, you’ll learn about all the most common anti-patterns in T-SQL querying and indexing, and how to spot them using execution plans. You’ll also leave knowing why they cause the problems that they do, and how you can solve them quickly and painlessly.

If you want to gain the knowledge and confidence to tune queries so they’ll never be slow again, this is the training you need.

Date: Dec 7 & 8.

Time: 12 PM to 04 PM EST (View in your timezone)

Tickets: Tickets here!

Going Further


If this is the kind of SQL Server stuff you love learning about, you’ll love my training. I’m offering a 75% discount to my blog readers if you click from here. I’m also available for consulting if you just don’t have time for that and need to solve performance problems quickly.

Why Microsoft Should Get Rid Of SQL Server’s Plan Cache And Use Query Store Instead

Used To Love Her


I used to think the plan cache was so cool.

  • You can find queries that aren’t good there
  • Plans are full of details (and XML)
  • Supporting DMVs give you extra insights about resource usage

But most of the time now, I’m totally frustrated with it.

It clears out a lot, plans aren’t there for some queries, and the plans that are there can be very misleading.

Can you really tell someone what their worst performing queries are when everything in there is from the last 15 minutes?

No.

Why I Like Query Store Better


Plans end up there for more definite amounts of time, even if you stick a recompile hint on them.

Plus, you get a whole lot more information about what went on with all the different query metrics. As far as a source of “what happened and when”, it’s much more reliable. It’s almost like having a monitoring tool in SQL Server.

Do you trust your plan cache to tell you what was slow more than a couple days ago?

One really big bonus is that it’s portable, and it’s per-database. You can backup or clone a database so someone else can easily look at it somewhere else.

On top of that, it’s more usable: there are built in reports, a graphical interface, settings you can tweak, and plans you can force with a couple clicks.

You could solve a lot of frustrations by moving things here.

Microsoft Has Work To Do, Though


There have been a number of issues, and unanswered user requests for Query Store over the years, and not all of the associated DMVs have full parity.

Querying the data also needs to be made less prone to performance issues. And, living in the future, it’s a much more sensible location for the last known actual plan.

A nice to have would be predicate normalization for identical and morally equivalent queries, with totals and averages for resource usage, so you could group things together. Especially for morally equivalent queries, this would allow plan forcing where the queries get different ids.

Some monitoring tools have this in their interface, and the number of times I’ve been able to track down outliers within a group of executions to solve a problem is, well, at least memorable to me.

I wish more people had monitoring tools.

Thanks for reading!

Going Further


If this is the kind of SQL Server stuff you love learning about, you’ll love my training. I’m offering a 75% discount to my blog readers if you click from here. I’m also available for consulting if you just don’t have time for that and need to solve performance problems quickly.