Stick And Move
If you take performance for your SQL Servers seriously, you should be using Query Store for your business critical databases.
I used to say this about third party monitoring tools, but the landscape for those has really tanked over the last few years. I used to really love SQL Sentry, but it has essentially become abandonware since SolarWinds bought SentryOne.
At this point, I’m happier to enable query store, and then use a couple extended events to capture blocking and deadlocks. While it would be stellar if Query Store also did that, for now life is easy enough.
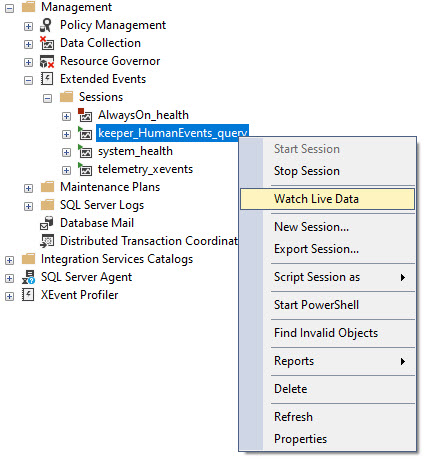
To analyze blocking and deadlock Extended Events, I use:
- sp_BlitzLock for deadlocks
- sp_HumanEventsBlockViewer for blocking
This won’t capture absolutely everything, but that’s okay. We can usually get enough to go on with those three things. If you have bad blocking and deadlocking problems, you should start there.
But once you turn on Query Store, where do you go?
Gooey
If you’re okay with all the limitations of the GUI, you can tweak a few things to get more useful information out of it.
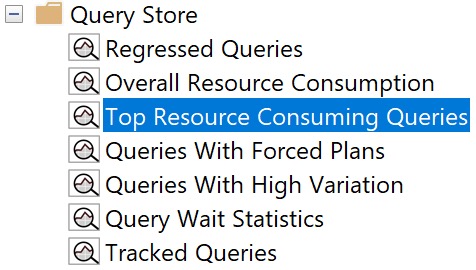
I usually start with the Top Resource Consuming Queries view, since, uh… those are usually good things to tune.
But the crappy bar graph that Query Store defaults to is not what you want to see. There’s way too much jumping around and mousing over things to figure out what’s in front of you.
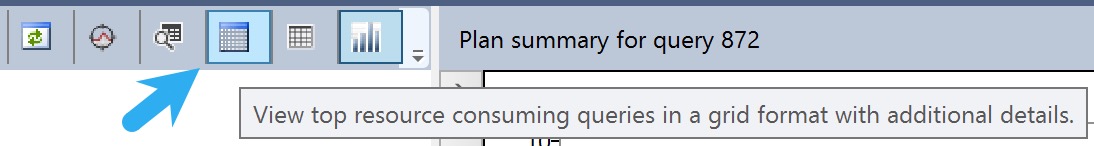
I like switching to the grid format with additional details view, by clicking the blue button like so:
But we’re not done yet! Not by a long shot. The next thing we wanna do is hit the Configure button, and change what we’re looking at. See, the other crappy thing is that Query Store defaults to showing you queries by total duration.
What ends up being in here is a bunch of stuff that runs a lot, but tends to run quickly. You might get lucky and find some quick wins here, but it’s usually not where the real bangers live.
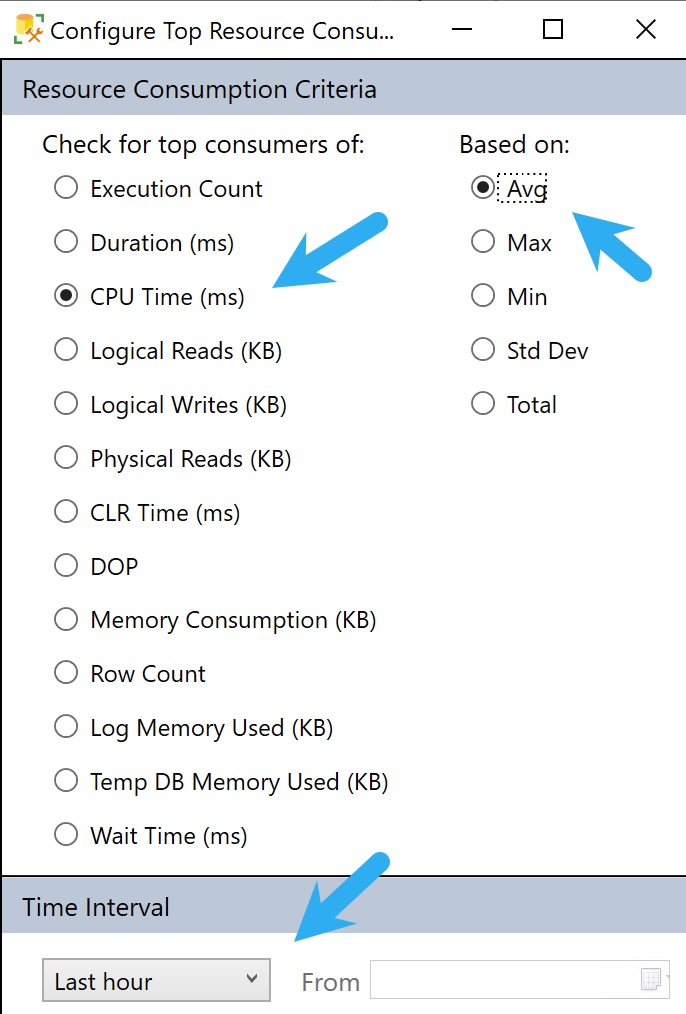
To get to those, we need to hit the Configure button and make a couple tweaks to look at queries that use a lot of CPU on average, and push the time back from only showing the last hour to the last week or so.
You can go back further, but usually the further you go back, the longer it takes to get you results.
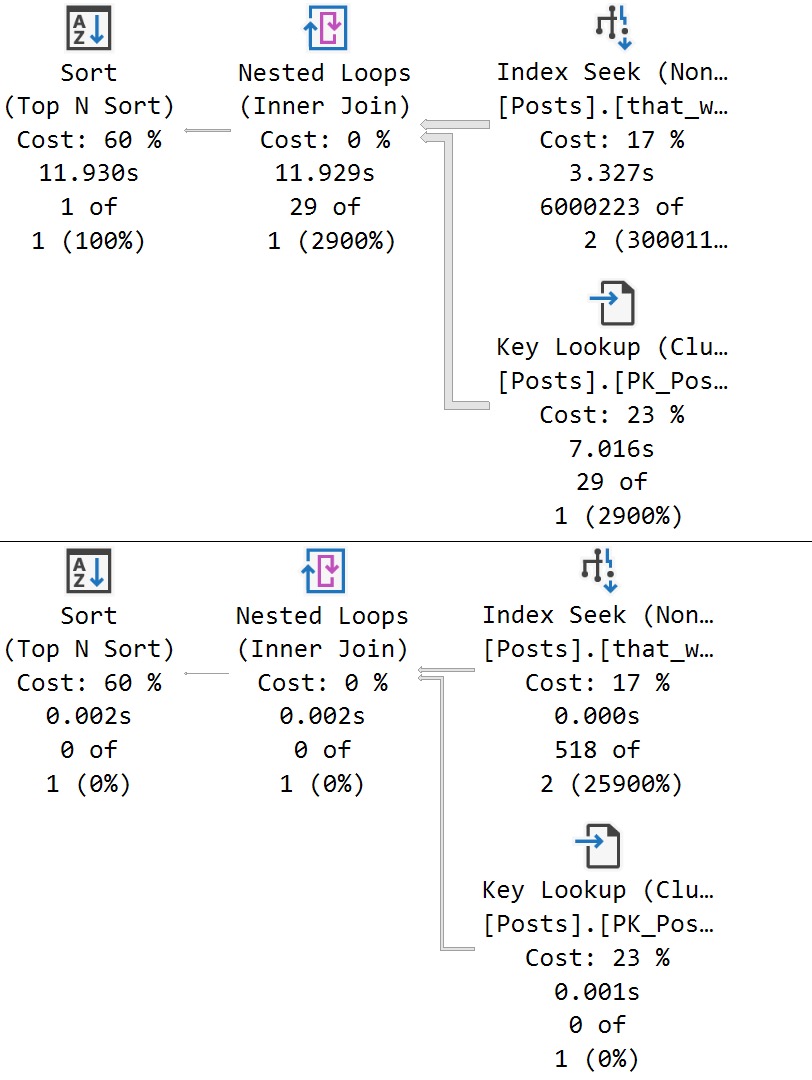
The problem here is that you can often get back quite a bit of noise that you can’t filter out or ignore. Here’s what mine looks like:
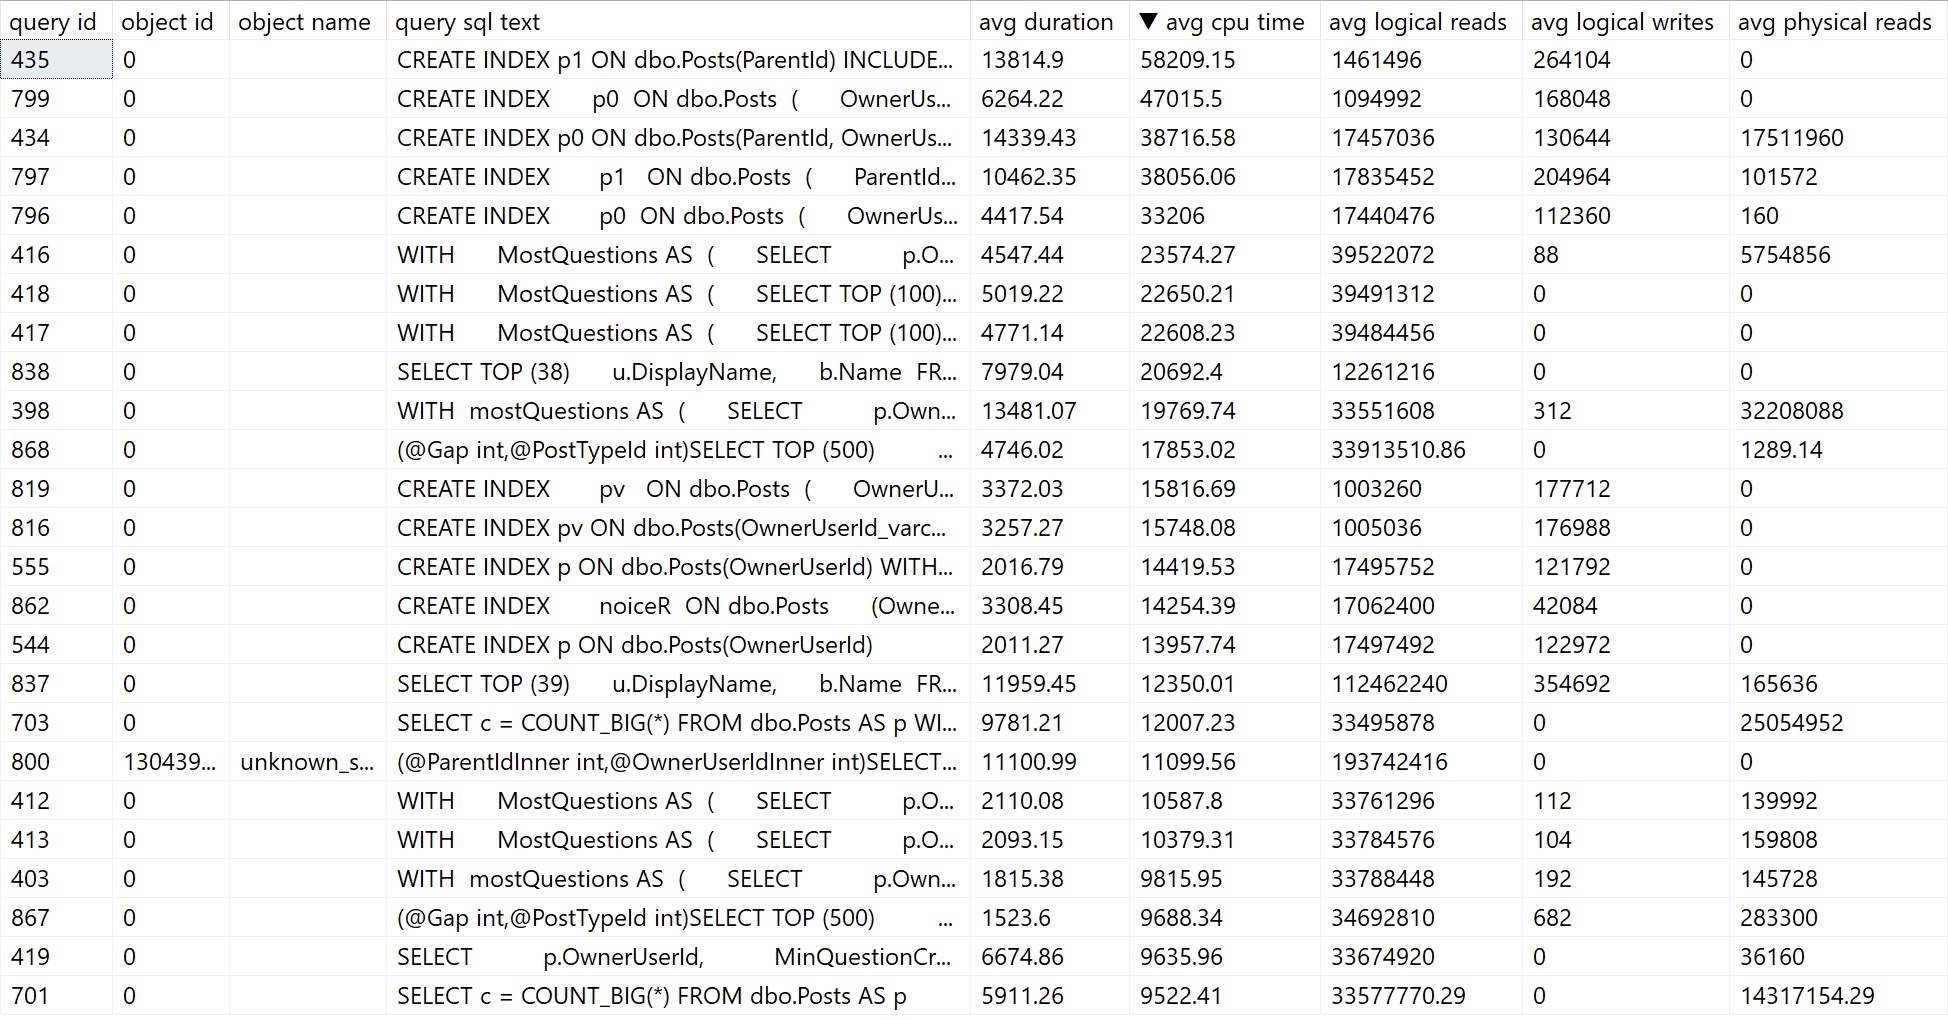
We don’t really need to know that creating indexes took a long time. Substitute those with queries you don’t necessarily care about fixing, and you get the point.
You can sort of control this by only asking for queries with a certain number of plans to come back, but if your queries aren’t parameterized and you have a lot of “single use” execution plans, you’ll miss out on those in the results.
This filter is available under the Configuration settings where we changes the CPU/Average/Dates before.
The major limitation of Query Store’s GUI is that you can’t search through it for specific problems. It totally could and should be in there, but as of this writing, it’s not in there.
That’s where my stored procedure sp_QuickieStore comes in.
Scripted, For Your Pleasure
The nice thing about sp_QuickieStore is that it gets rid of a lot of the click-clacking around to get things set up. You can’t save your Query Store GUI layout to open up and show you what you want every time, you have to redo it.
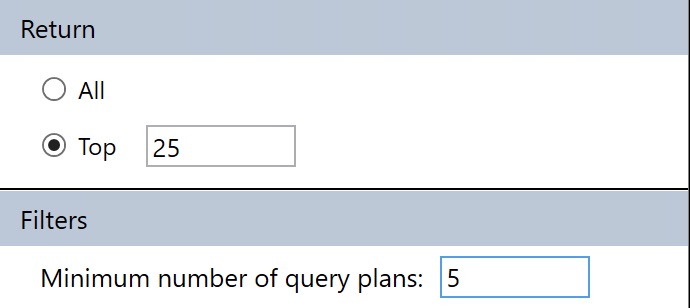
To get us to where we were with the settings above, all we have to do is this:
EXEC sp_QuickieStore
    @execution_count = 5;
By default, sp_QuickieStore will already sort results by average CPU for queries executed over the last week of Query Store data. It will also filter out plans for stuff we can’t really tune, like creating indexes, updating statistics, and waste of time index maintenance.
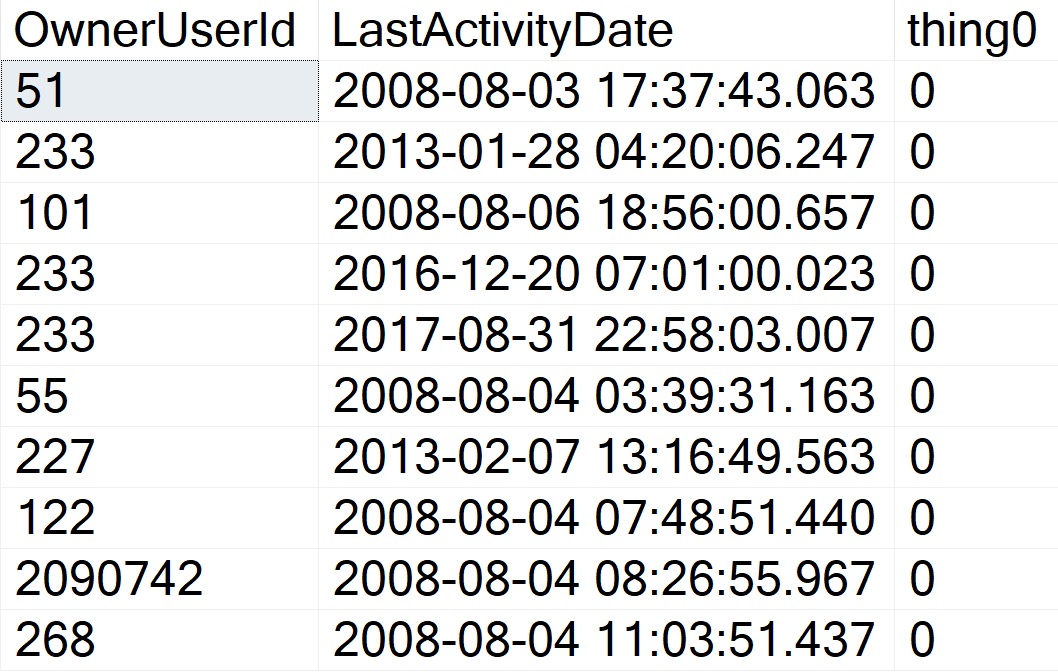
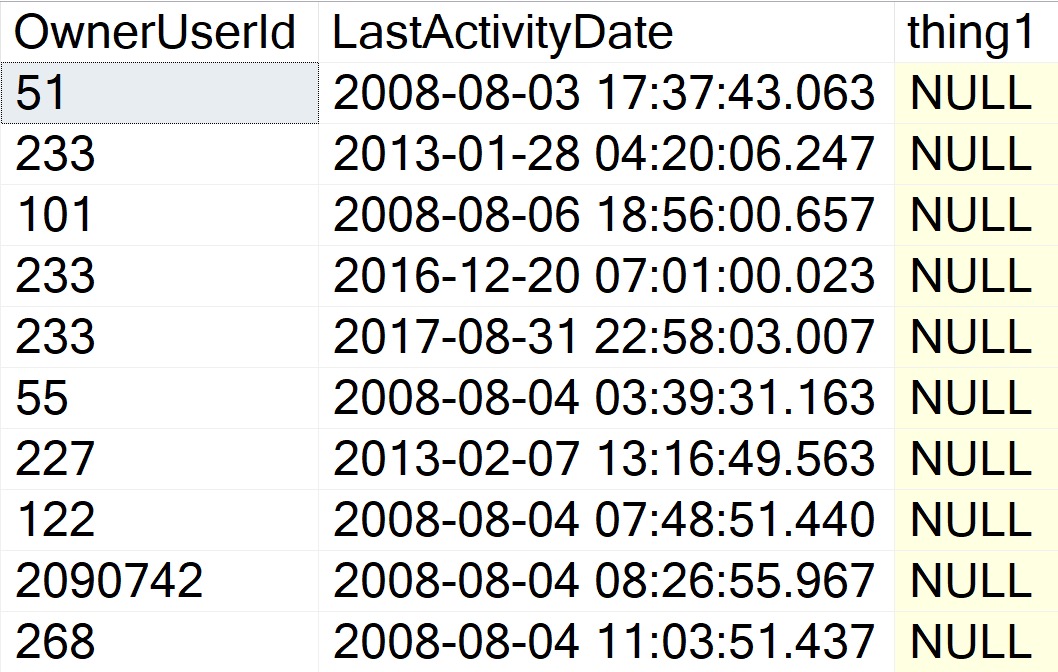
You’ll get results that look somewhat like so:
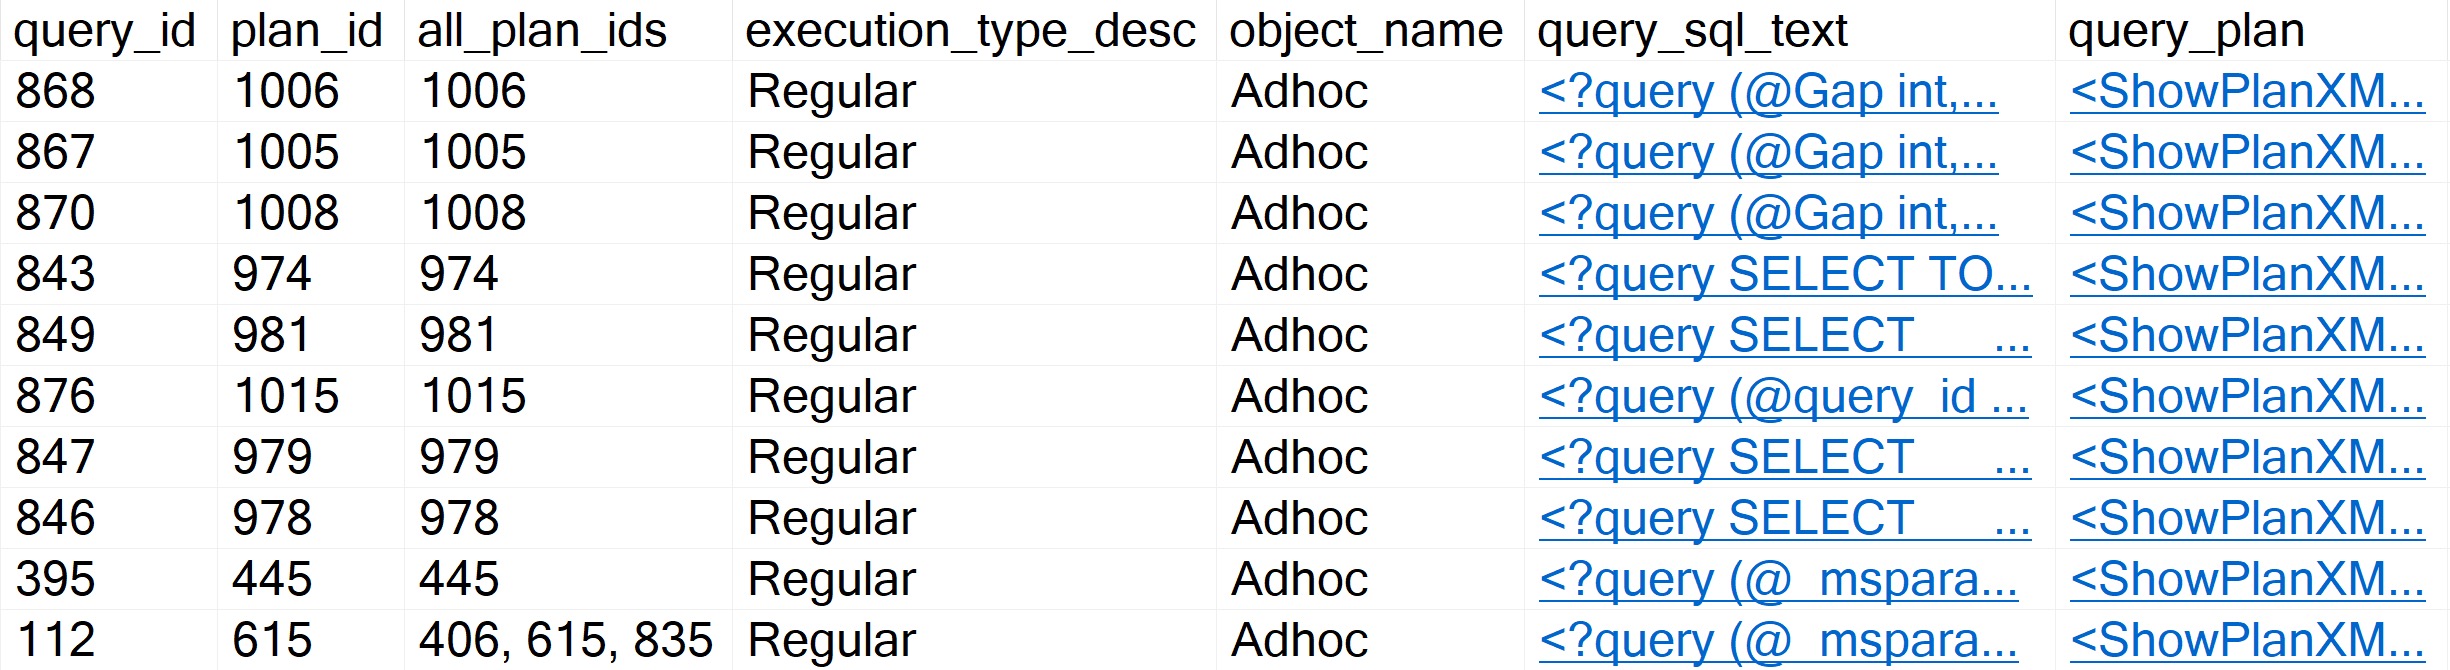
There are a number of things you can do with to include or ignore only certain information, too:
- @execution_count: the minimum number of executions a query must have
- @duration_ms: the minimum duration a query must have
- @execution_type_desc: the type of execution you want to filter
- @procedure_schema: the schema of the procedure you’re searching for
- @procedure_name: the name of the programmable object you’re searching for
- @include_plan_ids: a list of plan ids to search for
- @include_query_ids: a list of query ids to search for
- @ignore_plan_ids: a list of plan ids to ignore
- @ignore_query_ids: a list of query ids to ignore
- @include_query_hashes: a list of query hashes to search for
- @include_plan_hashes: a list of query plan hashes to search for
- @include_sql_handles: a list of sql handles to search for
- @ignore_query_hashes: a list of query hashes to ignore
- @ignore_plan_hashes: a list of query plan hashes to ignore
- @ignore_sql_handles: a list of sql handles to ignore
- @query_text_search: query text to search for
You straight up can’t do any of that with Query Store’s GUI. I love being able to focus in on all the plans for a specific stored procedure.
Thanks for reading!
Going Further
If this is the kind of SQL Server stuff you love learning about, you’ll love my training. I’m offering a 75% discount to my blog readers if you click from here. I’m also available for consulting if you just don’t have time for that, and need to solve database performance problems quickly. You can also get a quick, low cost health check with no phone time required.