Best Intentions
After seeing places where the Parameter Sensitive Plan (PSP) optimization quite stubbornly refuses to kick in, it’s somewhat amusing to see it kick in where it can’t possibly have any positive impact.
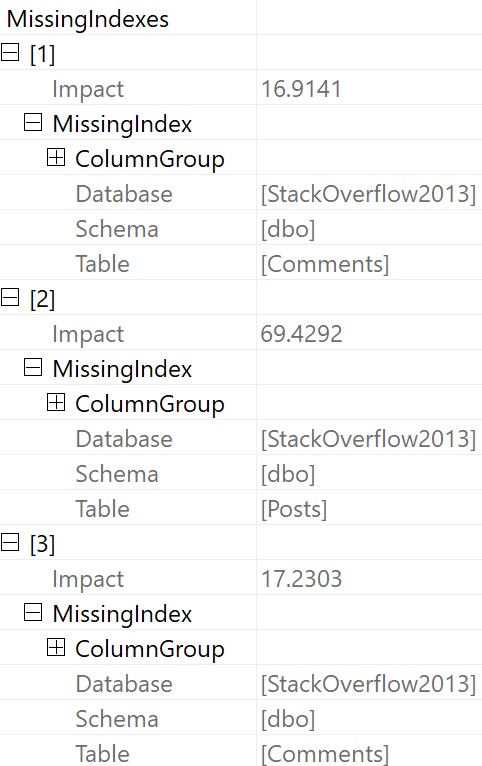
Even though some parameters are responsible for filtering on columns with highly skewed data, certain other factors may be present that don’t allow for the type of plan quality issues you might run into under normal parameter sensitivity scenarios:
- Adequate indexing
- Row goals
- Other filtering elements
This isn’t to say that they can always prevent problems, but they certainly tend to reduce risks much of the time.
If only everything were always ever perfect, you know?
Setup
Let’s start by examining some data in the Posts table.
First, PostTypeIds:
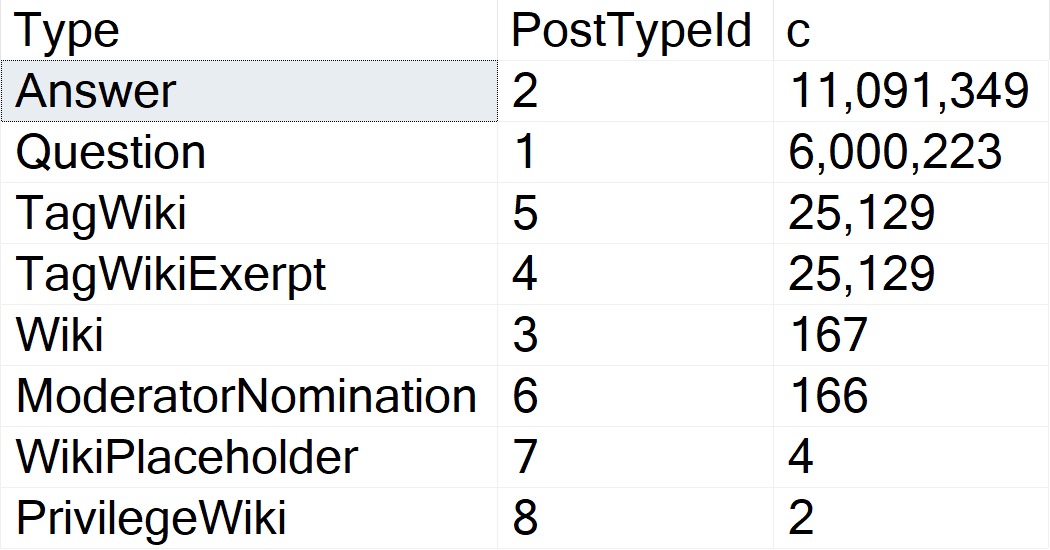
Questions and answers are the main types of Posts. The data is clearly skewed, here, and in my testing this does qualify for PSP on its own.
The thing is, there are several attributes that Questions can have that Answers can’t. One of those is a ParentId. Looking through how the top 15 or so of those counts breaks down:
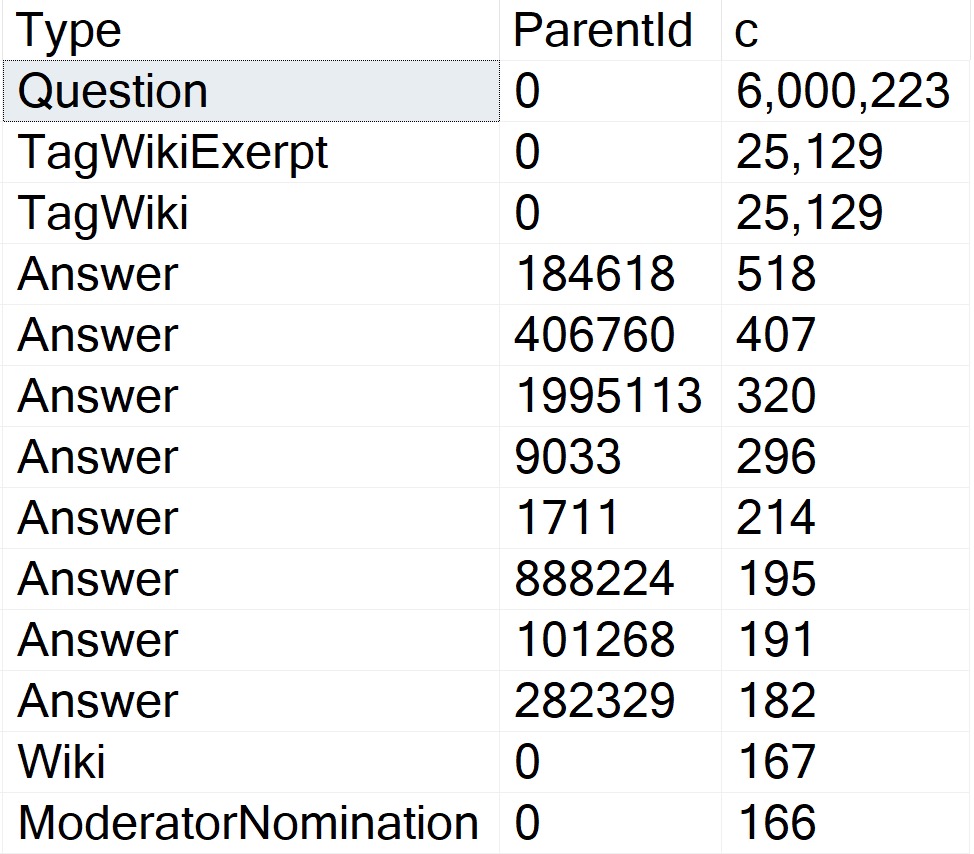
Okay, so! Wikis don’t have ParentIds, neither do Moderator Nominations. More importantly, Questions don’t.
The Question with the Most answers is Id 184618, with 518. A far cry from the next-nearest Post Types, and light years from the number of Questions with a ParentId of zero.
More important than loving your data is knowing your data.
To Query A Butterfly
Let’s say we have this query:
SELECT TOP (5000)
    p.Id,
    p.OwnerUserId,
    p.Score
FROM dbo.Posts AS p
WHERE p.PostTypeId = @po
AND   p.ParentId = @pa
ORDER BY
    p.Score DESC;
The three things we care about getting done are:
- Filtering to PostTypeId
- Filtering to ParentId
- Ordering by Score
Either of these indexes would be suitable for that:
CREATE INDEX
    popa
ON dbo.Posts
(
    PostTypeId,
    ParentId,
    Score DESC
)
WITH
(
    SORT_IN_TEMPDB = ON,
    DATA_COMPRESSION = PAGE
);

CREATE INDEX
    papo
ON dbo.Posts
(
    ParentId,
    PostTypeId,
    Score DESC
)
WITH
(
    SORT_IN_TEMPDB = ON,
    DATA_COMPRESSION = PAGE
);
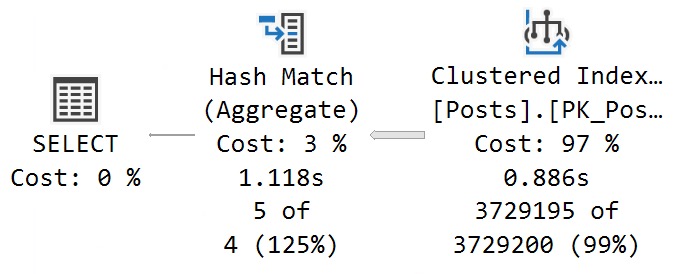
With No PSP At All
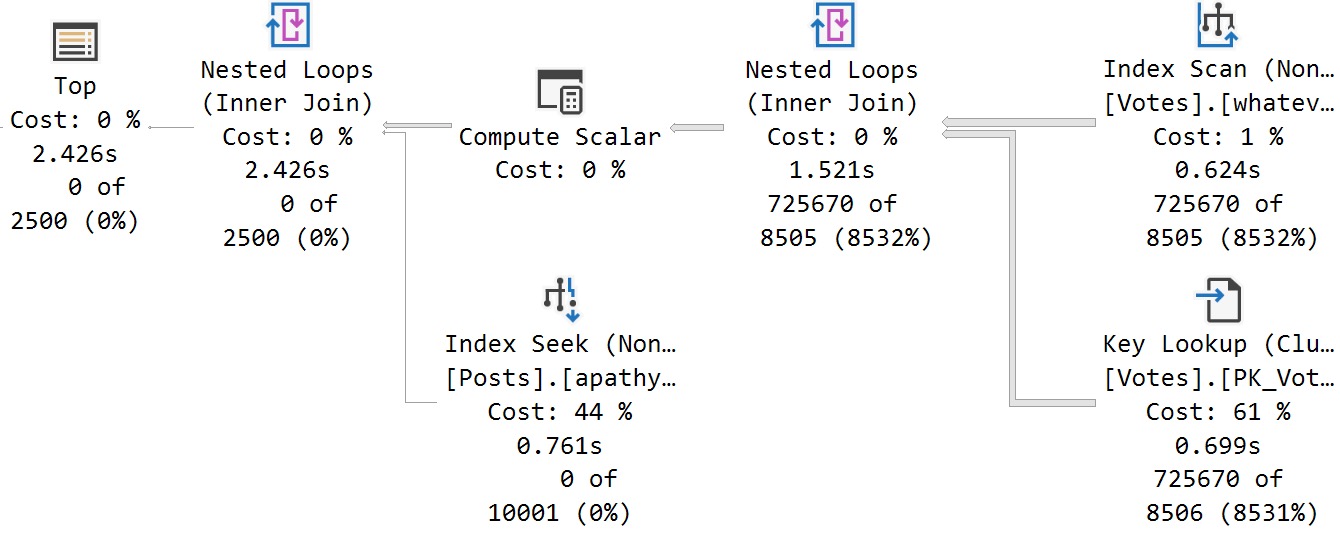
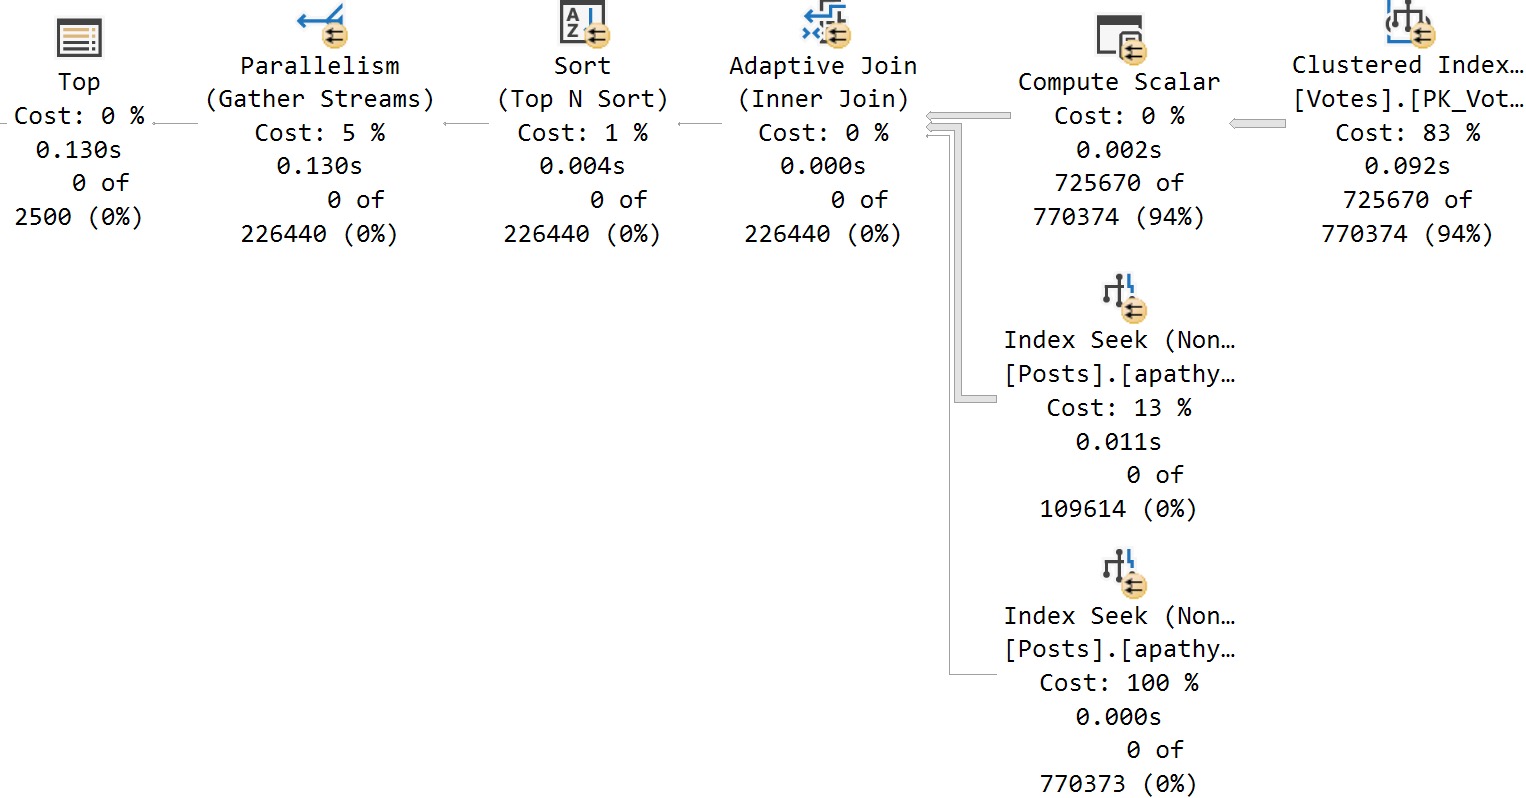
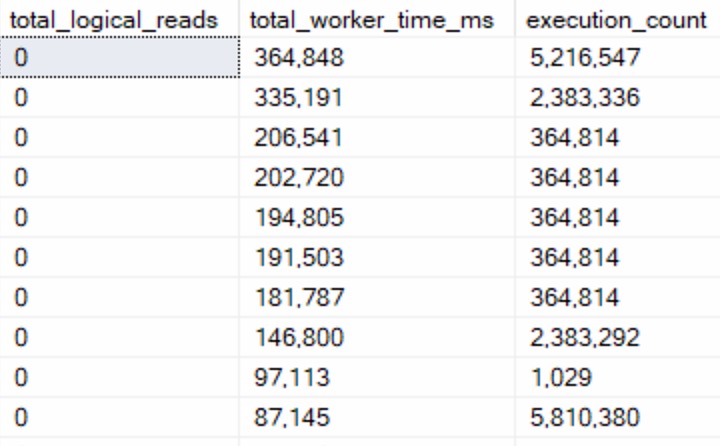
Under compatibility level 150, we can run the query in a variety of ways and get nearly identical performance results:
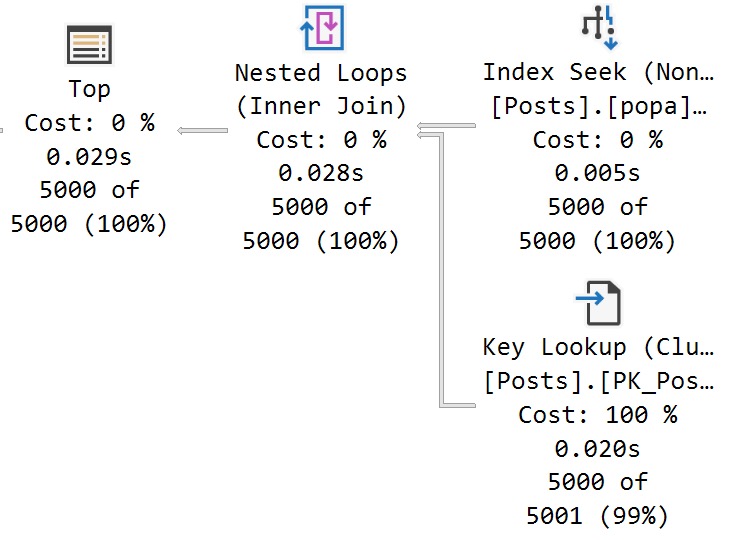
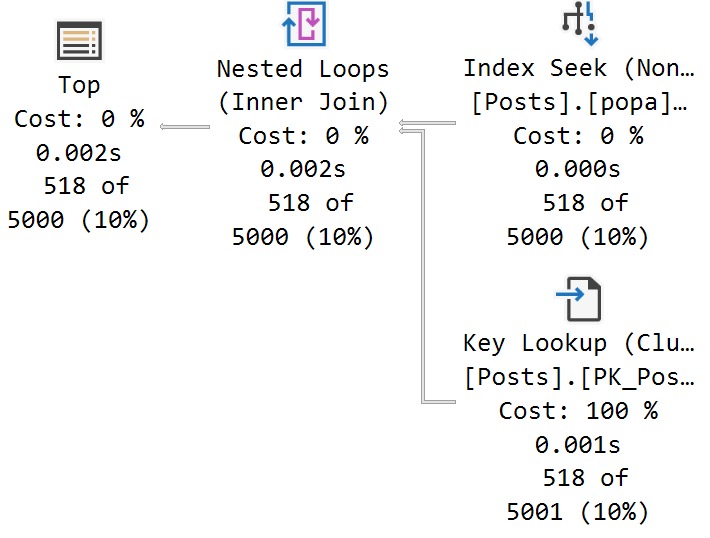
There’s a 27 millisecond difference between the two to find the first 5000 rows that match both predicates. You would have to run these in a very long loop to accumulate a meaningful overall difference.
In this case, both queries use and reuse the same execution plan. You can see that in the estimates.
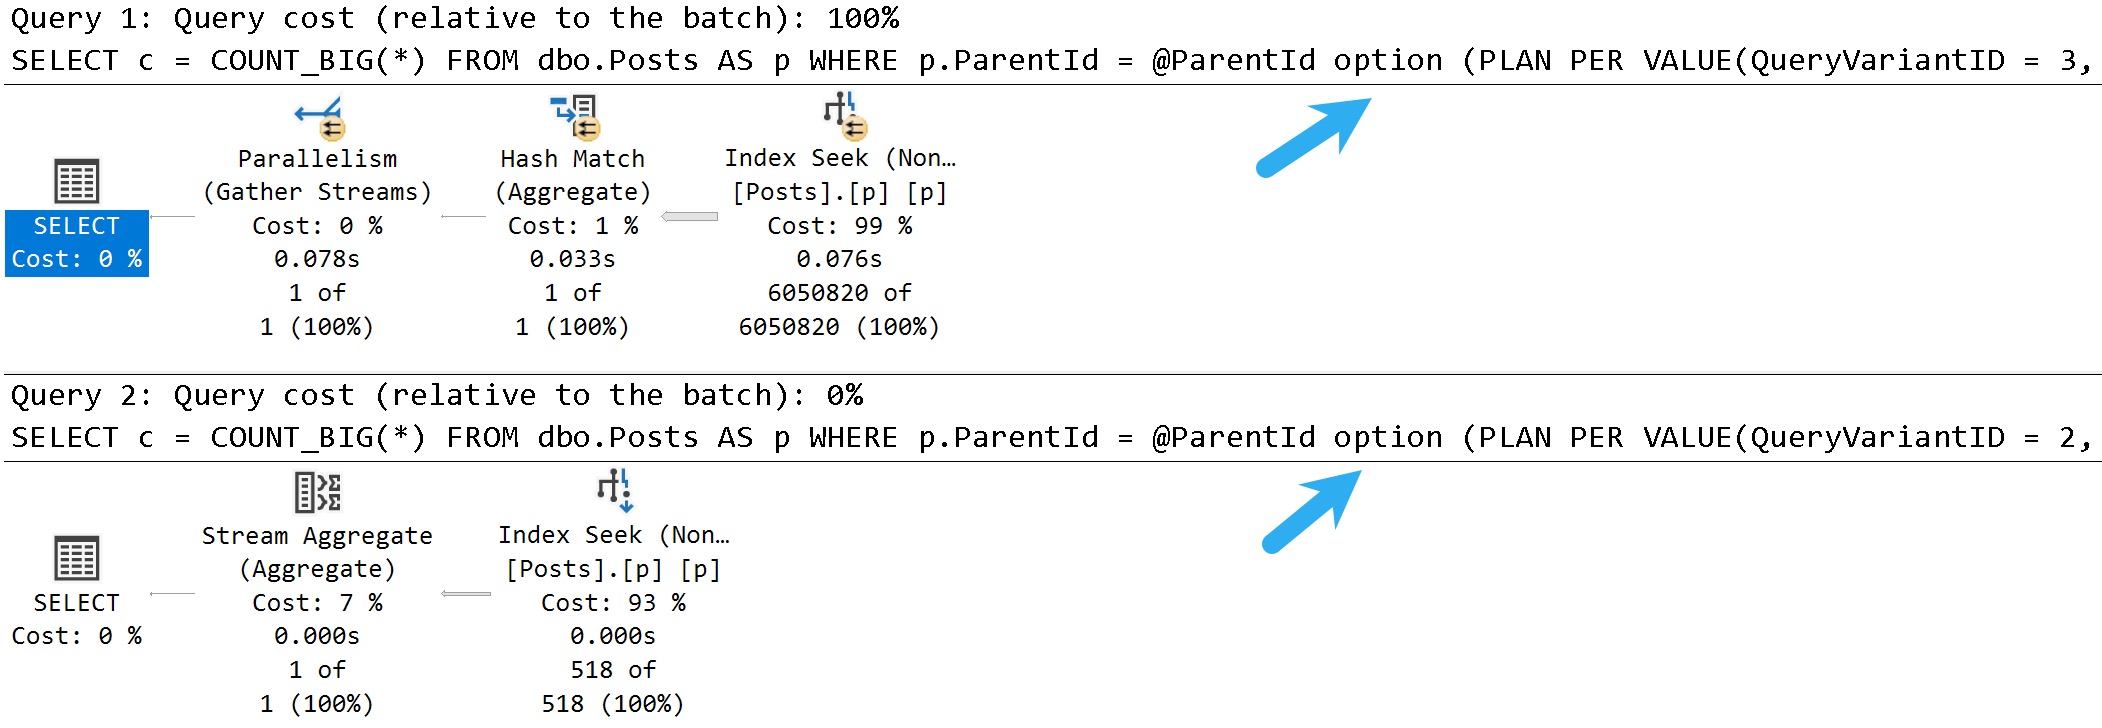
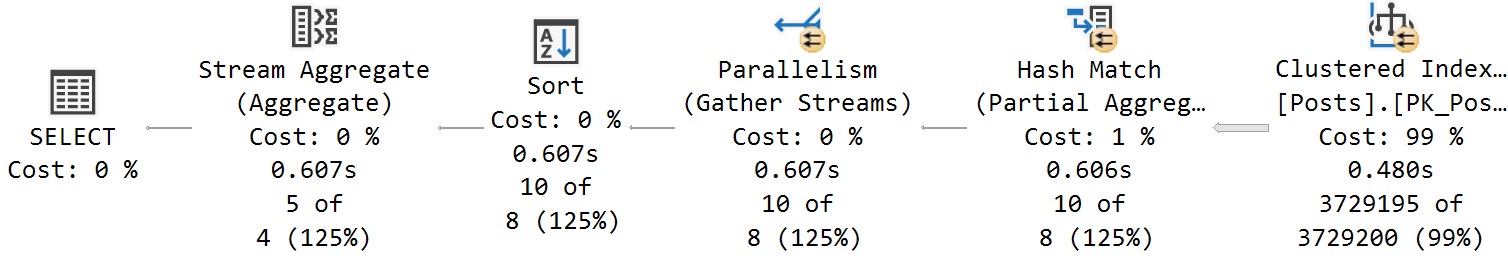
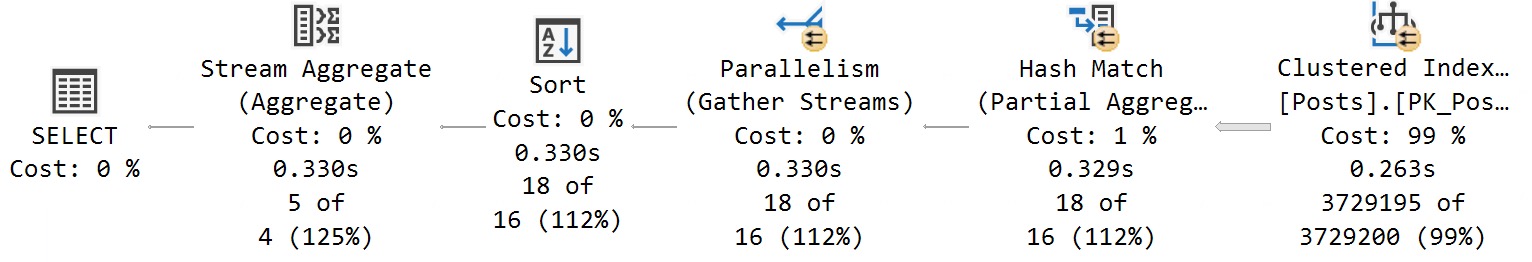
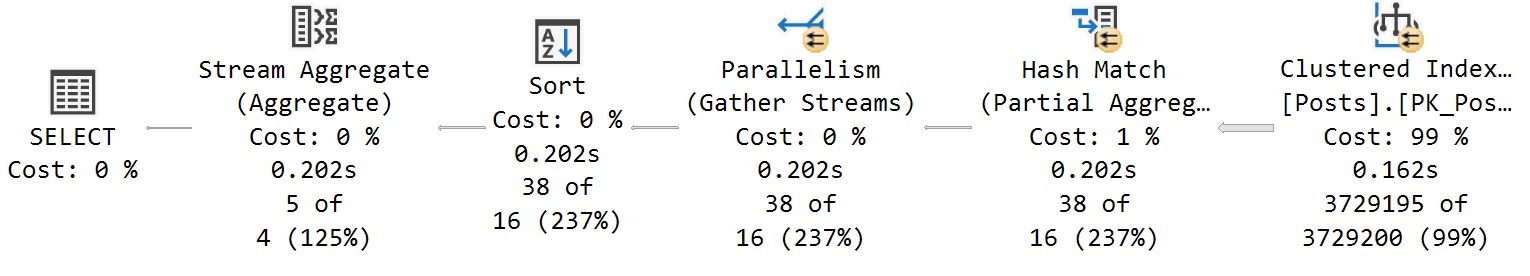
With All The PSP
Switching to compat level 160, the queries are injected with the PLAN PER VALUE hint.
SELECT TOP (5000)
    p.Id,
    p.OwnerUserId,
    p.Score
FROM dbo.Posts AS p
WHERE p.PostTypeId = @po
AND   p.ParentId = @pa
ORDER BY
    p.Score DESC
OPTION
(
    PLAN PER VALUE
    (
        QueryVariantID = 2,
        predicate_range
        (
            [StackOverflow2013].[dbo].[Posts].[PostTypeId] = @po,
            100.0,
            10000000.0
        )
    )
)

SELECT TOP (5000)
    p.Id,
    p.OwnerUserId,
    p.Score
FROM dbo.Posts AS p
WHERE p.PostTypeId = @po
AND   p.ParentId = @pa
ORDER BY
    p.Score DESC
OPTION
(
    PLAN PER VALUE
    (
        QueryVariantID = 3,
        predicate_range
        (
            [StackOverflow2013].[dbo].[Posts].[PostTypeId] = @po,
            100.0,
            10000000.0
        )
    )
)
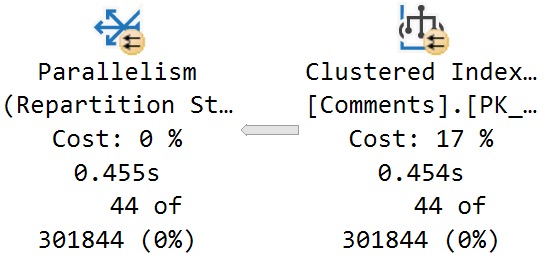
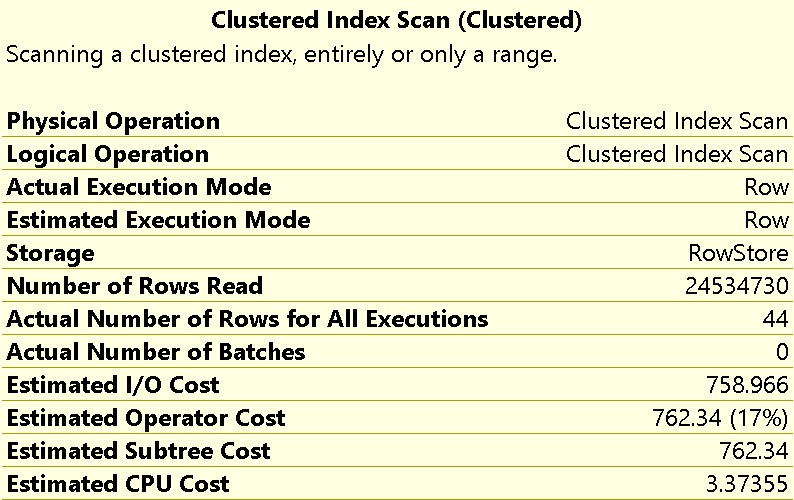
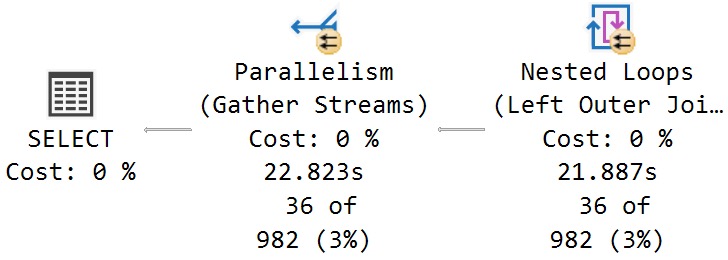
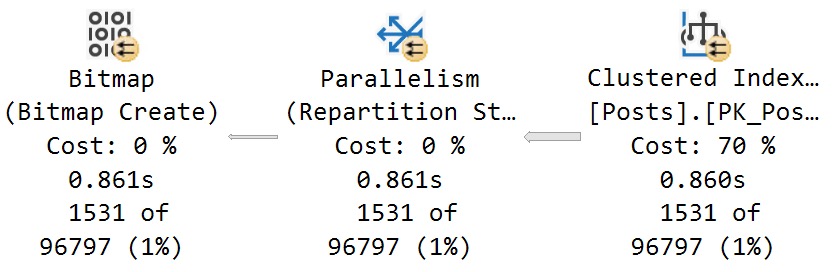
The thing is, both queries end up with identical execution times to when there was no PSP involved at all.
In other words, there is no parameter sensitivity in this scenario, despite there being skew in the column data.
Even searching for the “big” result — Questions with a ParentId of zero, finishes in <30 milliseconds.
Ah well. Gotta train the models somehow.
Thanks for reading!
Going Further
If this is the kind of SQL Server stuff you love learning about, you’ll love my training. I’m offering a 75% discount to my blog readers if you click from here. I’m also available for consulting if you just don’t have time for that and need to solve performance problems quickly.