If you use any of my stored procedures, I’ve been doing a lot of work on them lately to improve performance, add features, and fix bugs.
There have been a lot of changes over the past few months, and the full list would be a little unwieldy.
sp_HumanEvents: Mostly adding useful columns the output and improving the XML processing
sp_HumanEventsBlockViewer: This is a newer procedure to examine a blocked process report extended event session, and not a lot of folks know about it. Try it out!
sp_PressureDetector: Added tempdb configuration and usage details, some more wait stats, additional CPU details, etc. A fan favorite.
sp_QuickieStore: Added the ability to analyze multiple databases, improve speed, and add more helpful details to the output
sp_WhoIsActive Logging: Added a procedure to create a view over all of the daily logging tables
If you use any of these, get those updates going. If you’re not using them: what are you waiting for? They’re free!
Thanks for reading!
Going Further
If this is the kind of SQL Server stuff you love learning about, you’ll love my training. I’m offering a 75% discount to my blog readers if you click from here. I’m also available for consulting if you just don’t have time for that, and need to solve database performance problems quickly. You can also get a quick, low cost health check with no phone time required.
CREATE EVENT SESSION keeper_HumanEvents_query
    ON SERVER
      ADD EVENT sqlserver.module_end
        (SET collect_statement = 1
         ACTION (sqlserver.database_name, sqlserver.sql_text, sqlserver.plan_handle, sqlserver.query_hash_signed, sqlserver.query_plan_hash_signed)
         WHERE (
            sqlserver.is_system = 0
     AND duration >= 5000000
     AND sqlserver.session_id = 60
 )),
      ADD EVENT sqlserver.rpc_completed
        (SET collect_statement = 1
         ACTION(sqlserver.database_name, sqlserver.sql_text, sqlserver.plan_handle, sqlserver.query_hash_signed, sqlserver.query_plan_hash_signed)
         WHERE (
            sqlserver.is_system = 0
     AND duration >= 5000000
     AND sqlserver.session_id = 60
 )),
      ADD EVENT sqlserver.sp_statement_completed
        (SET collect_object_name = 1, collect_statement = 1
         ACTION(sqlserver.database_name, sqlserver.sql_text, sqlserver.plan_handle, sqlserver.query_hash_signed, sqlserver.query_plan_hash_signed)
         WHERE (
            sqlserver.is_system = 0
     AND duration >= 5000000
     AND sqlserver.session_id = 60
 )),
      ADD EVENT sqlserver.sql_statement_completed
        (SET collect_statement = 1
         ACTION(sqlserver.database_name, sqlserver.sql_text, sqlserver.plan_handle, sqlserver.query_hash_signed, sqlserver.query_plan_hash_signed)
         WHERE (
            sqlserver.is_system = 0
     AND duration >= 5000000
     AND sqlserver.session_id = 60
 )),
      ADD EVENT sqlserver.query_post_execution_showplan
        (
         ACTION(sqlserver.database_name, sqlserver.sql_text, sqlserver.plan_handle, sqlserver.query_hash_signed, sqlserver.query_plan_hash_signed)
         WHERE (
            sqlserver.is_system = 0
     AND duration >= 5000000
     AND sqlserver.session_id = 60
 ))
I collect:
module_end
rpc_completed
sp_statement_completed
sql_statement_completed
query_post_execution_showplan
Not all of them are relevant to stored procedure calls, but in larger contexts where I have no idea where long running queries might be coming from, it’s useful to get all these.
Weirdness, Weirdness
Where I find things getting somewhat annoying is when things start showing up in there that meet the duration filter, but don’t really give me anything further to go on.
To simulate what I mean, I’m going to use this stored procedure:
CREATE OR ALTER PROCEDURE
    dbo.Eventually
AS
BEGIN

    SET NOCOUNT, XACT_ABORT ON;

    WAITFOR DELAY '00:00:01.000';
    SELECT TOP (1) * FROM dbo.Badges AS b;
    WAITFOR DELAY '00:00:01.000';
    SELECT TOP (1) * FROM dbo.Comments AS c;
    WAITFOR DELAY '00:00:01.000';
    SELECT TOP (1) * FROM dbo.Posts AS p;
    WAITFOR DELAY '00:00:01.000';
    SELECT TOP (1) * FROM dbo.Users AS u;
    WAITFOR DELAY '00:00:01.000';
    SELECT TOP (1) * FROM dbo.Votes AS v;
    WAITFOR DELAY '00:00:01.000';

END;
GO

EXEC dbo.Eventually;
There are six waitfor commands that each pause for 1 second. In between them are queries that finish in milliseconds.
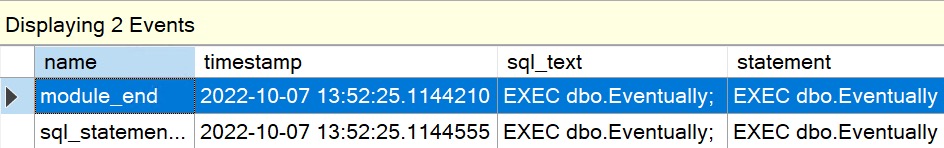
If I watch the event output, eventually, I’ll see this:
lied to me, cried to me
Okay, so the stored procedure took more than 5 seconds, but… no individual query took more than 5 seconds.
To troubleshoot further, I have to set the duration bar even lower, and then figure out what I can meaningfully tune.
Do I have one query that takes four seconds
Do I have ten queries that take 500 milliseconds
Do I have 500 queries that take ten milliseconds
I see this behavior quite a bit with queries that loop/cursor over tons of data. They might take a whole bunch of rows and do a lot of really fast queries over them, but the time adds up.
There’s not really a good solution for this, either. The closer you look, by reducing the duration filter to lower and lower values, the more you return, the more overhead you cause, and the longer you have to wait for things to finish.
Sure, you can wring someone’s neck about not “thinking in sets”, but that doesn’t help when the processing takes place by passing looped values to stored procedures, unless you have the freedom to make significant app changes by using table valued parameters or something instead.
Thanks for reading!
Going Further
If this is the kind of SQL Server stuff you love learning about, you’ll love my training. I’m offering a 75% discount to my blog readers if you click from here. I’m also available for consulting if you just don’t have time for that, and need to solve database performance problems quickly. You can also get a quick, low cost health check with no phone time required.
Over the past month (plus or minus a couple days), I’ve shown you in a series of quick posts how I use different SQL Server Community Tools that are free and open source to troubleshoot SQL Server issues.
If this is the kind of SQL Server stuff you love learning about, you’ll love my training. I’m offering a 75% discount to my blog readers if you click from here. I’m also available for consulting if you just don’t have time for that, and need to solve database performance problems quickly. You can also get a quick, low cost health check with no phone time required.
I have sort of a love/hate relationship with wait stats scripts and analysis. Sometimes they’re great to correlate with larger performance problems or trends, and other times they’re totally useless.
When you’re looking at wait stats, some important things to figure out are:
How much of a wait happened compared to uptime
If the waits lasted a long time on average
And you can do that out of the box with SQL Server. What you can’t get are two very important things:
When the waits happened
Which queries caused the waits
This stuff is vitally important for figuring out if wait stats are benign overall to the workload.
For example, let’s say your server has been up for 100 hours, and you spent 50 hours waiting on PAGEIOLATCH_SH waits. Normally I’d be pretty worried about that, and I’d be looking at if the server has enough memory, if queries are asking for big memory grants, if important queries are missing any indexes, etc.
But if we knew that all 50 of those hours were outside of normal use activity, and maybe even happened in a separate database for warehousing or archiving off data, we might be able to ignore it and focus on other portions of the workload.
When this finishes running, you’ll get three results back:
Overall wait stats for the period of time
Wait stats broken down by database for the period of time
Wait stats broken down by database and query for the period of time
And because I don’t want to leave you hanging, you’ll also get details about the waits themselves, like
How much of a wait happened compared to sampled time
How long the waits lasted on average in the sampled time
If you need to figure out which queries are causing wait stats that you’re worried about, this is a great way to get started with that investigation.
Thanks for reading!
Going Further
If this is the kind of SQL Server stuff you love learning about, you’ll love my training. I’m offering a 75% discount to my blog readers if you click from here. I’m also available for consulting if you just don’t have time for that, and need to solve database performance problems quickly. You can also get a quick, low cost health check with no phone time required.
Like query compilations, query recompilations can be annoying. The bigger difference is that even occasional recompiles can introduce a bad query plan.
If your monitoring tools or scripts are warning you about high compiles or recompiles, sp_HumanEvents can help you dig in further.
We talked about compilations yesterday (and, heck, maybe I should have added that point in there, but hey), so today we’ll talk about recompilations.
There are a lot of reasons why a query might recompile:
Schema changed
Statistics changed
Deferred compile
Set option change
Temp table changed
Remote rowset changed
For browse permissions changed
Query notification environment changed
PartitionView changed
Cursor options changed
Option (recompile) requested
Parameterized plan flushed
Test plan linearization
Plan affecting database version changed
Query Store plan forcing policy changed
Query Store plan forcing failed
Query Store missing the plan
Interleaved execution required recompilation
Not a recompile
Multi-plan statement required compilation of alternative query plan
Query Store hints changed
Query Store hints application failed
Query Store recompiling to capture cursor query
Recompiling to clean up the multiplan dispatcher plan
That list is from SQL Server 2022, so there are going to be some listed here that you might not see just yet.
But let’s face it, the reasons you’re gonna see most often is probably
Schema changed
Statistics changed
Temp table changed
Option (recompile) requested
Mad Dog
To capture which queries are recompiling in a certain window, I’ll usually do something like this:
Schema changed: use a new index that suits the query better
Statistics changed: use newer statistics that more accurately reflect column data
Temp table changed: use a new histogram for a temp table more relevant to the query
Option (recompile) requested: burn it flat, salt the earth
But of course, there’s always an element of danger, danger when a query starts using a new plan. What if it sucks?
To cut down on recompiles, you can use this stuff:
Plan Guides
Query Store forced plans
Keep Plan/KeepFixed Plan query hints
Stop using recompile hints?
One thing that can be a pretty big bummer about recompiles is that, if you’re relying solely on the plan cache to find problem queries, they can leave you with very little (or zero) evidence about what queries are getting up to.
Query Store and some monitoring tools will capture them, so you’re better off using those for more in-depth analysis.
Thanks for reading!
Going Further
If this is the kind of SQL Server stuff you love learning about, you’ll love my training. I’m offering a 75% discount to my blog readers if you click from here. I’m also available for consulting if you just don’t have time for that, and need to solve database performance problems quickly. You can also get a quick, low cost health check with no phone time required.
One thing that I have to recommend to clients on a fairly regular basis is to enable Forced Parameterization. Many vendor applications send over queries that aren’t parameterized, or without strongly typed parameters, and that can make things… awkward.
Every time SQL Server gets one of those queries, it’ll come up with a “new” execution plan, cache it, and blah blah blah. That’s usually not ideal for a lot of reasons.
There are potentially less tedious ways to figure out which queries are causing problems, by looking in the plan cache or query store.
One way to start getting a feel for which queries are compiling the most, along with some other details about compilation metrics and parameterization is to do this:
Newer versions of SQL Server have an event called query_parameterization_data.
Fired on compile for every query relevant for determining if forced parameterization would be useful for this database.
If you start monitoring compilations with sp_HumanEvents you’ll get details from this event back as well, as long as it’s available in your version of SQL Server.
You can find all sorts of tricky application problems with this event setup.
Thanks for reading!
Going Further
If this is the kind of SQL Server stuff you love learning about, you’ll love my training. I’m offering a 75% discount to my blog readers if you click from here. I’m also available for consulting if you just don’t have time for that, and need to solve database performance problems quickly. You can also get a quick, low cost health check with no phone time required.
In yesterday’s post, I talked through how I capture blocking using sp_HumanEvents. Today I’m going to talk about a couple different ways I use it to capture query performance issues.
One thing I want to stress is that you shouldn’t use yesterday’s technique to gather query performance issues. One thing sp_HumanEvents does is capture actual execution plans, and that can really bog a server down if it’s busy.
I tend to use it for short periods of time, or for very targeted data collection against a single stored procedure or session id running things.
I’ve occasionally toyed with the idea of adding a flag to not get query plans, or to use a different event to get them.
I just don’t think there’s enough value in that to be worthwhile since the actual execution plan has so many important details that other copies do not.
So anyway, let’s do a thing.
Whole Hog
You can totally use sp_HumanEvents to grab absolutely everything going on like this:
You may need to do this in some cases when you’re first getting to know a server and need to get a feeling for what’s going on. This will show you any query that takes 5 seconds or longer in the 20 second window the session is alive for.
If you’re on a really busy server, it can help to cut down on how much you’re pulling in:
This will only pull in data from sessions if their spid is divisible by 5. The busier your server is, the weirder you might want to make this number, like 15/17/19 or something.
Belly
Much more common for me is to be on a development server, and want to watch my spid as I execute some code:
This is especially useful if you’re running a big long stored procedure that calls a bunch of other stored procedures, and you want to find all the statements that take a long time without grabbing every single query plan.
If you’ve ever turned on Actual Execution Plans and tried to do this, you might still be waiting for SSMS to become responsive again. It’s really painful.
By only grabbing query details for things that run a long time, you cut out all the little noisy queries that you can’t really tune.
I absolutely adore this, because it lets me focus in on just the parts that take a long time.
Shoulder
One pretty common scenario is for clients to give me a list of stored procedures to fix. If they don’t have a monitoring tool, it can be a challenge to understand things like:
How users call the stored procedure normally
If the problem is parameter sniffing
Which queries in the stored procedure cause the biggest problems
This will only collect sessions executing a single procedure. I’ll sometimes do this and work through the list.
Hoof
There are some slight differences in how I call the procedure in different circumstances.
When I use the @seconds_sample parameter, sp_HumanEvents will run for that amount of time and then spit out a result
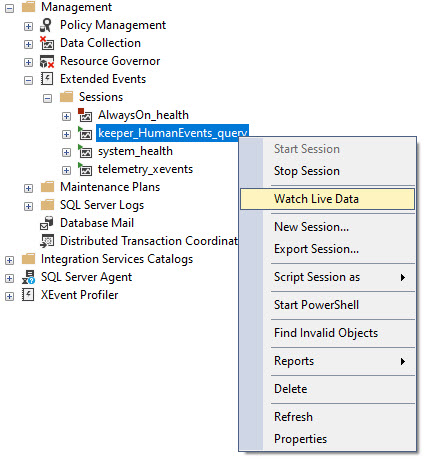
When I use the @keep_alive parameter, all that happens is a session gets created and you need to go watch live data like this:
viewme
Just make sure you do that before you start running your query, or you might miss something important.
Thanks for reading!
Going Further
If this is the kind of SQL Server stuff you love learning about, you’ll love my training. I’m offering a 75% discount to my blog readers if you click from here. I’m also available for consulting if you just don’t have time for that, and need to solve database performance problems quickly. You can also get a quick, low cost health check with no phone time required.
Unlike most people who left links in the comments, I read the entire post and decided to use the whole darn month to write about scripts I maintain and how I use them in my work.
Lest I be accused of not being able to read a calendar, I know that these are dropping a little earlier than the 1st of September. I do apologize for September not starting on a Monday.
There are other great tools and utilities out there, like Andy Mallon’s DBA Utility Database, but I don’t use them enough personally to be able to write about them fluently.
My goal here is to help you use each script with more confidence and understanding. Or even any confidence and understanding, if none existed beforehand.
Oral Board
First up is (well, I think) my most ambitious script: sp_HumanEvents. If you’re wondering why I think it’s so ambitious, it’s because the goal is to make Extended Events usable by Humans.
At present, that’s around 4000 lines of T-SQL. Now, sp_HumanEvents can do a lot of stuff, including logging event data to tables for a bunch of different potential performance issues.
When I was first writing this thing, I wanted it to be able to capture data in a few different ways to fit different monitoring scenarios. In this post, I’m going to show you how I most often use it on systems that have are currently experiencing blocking.
First, you need to have the Blocked Process Report enabled, which is under advanced options:
If you want to flip the advanced options setting back, you can. I usually leave it set to 1.
The second command turns on the blocked process report, and tells SQL Server to log any instances of blocking going on for 5 or more seconds. You can adjust that to meet your concerns with blocking duration, but I wouldn’t set it too low because there will be overhead, like with any type of monitoring.
Blockeroos
The way I usually set up to look at blocking that’s currently happening on a system — which is what I most often have to do — is to set up a semi-permanent session and watch what data comes in.
When I want to parse that data, I use sp_HumanEventsBlockViewer to do that. At first, I just want to see what kind of stuff starts coming in.
What this will do is set up an Extended Event session to capture blocking from the Blocked Process Report. That’s it.
From there, you can either use my script (linked above), or watch data coming in via the GUI. Usually I watch the GUI until there’s some stuff in there to gawk at:
If this is the kind of SQL Server stuff you love learning about, you’ll love my training. I’m offering a 75% discount to my blog readers if you click from here. I’m also available for consulting if you just don’t have time for that, and need to solve database performance problems quickly. You can also get a quick, low cost health check with no phone time required.
One of them fixes a bug with view creation when you use a custom schema. The rest are minor tweaks and fixes that you (hopefully won’t notice one bit), but make me feel a little bit better about the state of the code.
I took a look through SQL Server 2022’s new Extended Events, and haven’t seen anything in there that would warrant the amount of work it takes to add something new just yet. Maybe at some point, I suppose.
Some folks had asked about adding lightweight query profiling etc. as an option, but it still doesn’t return the kind of details that make it useful for query tuning.
I mean, I guess if you believe in memes it’s okay, but… Maybe you should stop that.
Thanks for reading!
Going Further
If this is the kind of SQL Server stuff you love learning about, you’ll love my training. I’m offering a 75% discount to my blog readers if you click from here. I’m also available for consulting if you just don’t have time for that and need to solve performance problems quickly.
Fixed a bug where date filtering was messing up query results
Enjoy, and as always, please let me know if there’s anything I can do to improve the scripts usability, or any issues you encounter while using them.
Thanks for reading!
Going Further
If this is the kind of SQL Server stuff you love learning about, you’ll love my training. I’m offering a 75% discount to my blog readers if you click from here. I’m also available for consulting if you just don’t have time for that and need to solve performance problems quickly.