I’m Officially A Maintainer Of sp_WhoIsActive!

Busyness, Man


sp_WhoIsActive is probably one of the most famous utilities in SQL Server. To the point where when I see people using sp_who – sp_who4762, I immediately disqualify their ability as a DBA.

If you think that’s unfair, it’s probably because you use sp_who2.

But anyway, with Mr. Machanic being busy with outside of SQL Server projects, the script hadn’t been getting much attention lately. Since I had been working on a couple issues, and saw other piling up, I offered to help with Adam’s project in the same way I help with the First Responder Kit stuff.

hired

I’ll be working on issues over there to get new stuff and bug fixes into the script. If there’s anything you’d like to see in there, or see fixed, let us know!

Help You


If you’re hitting an issue with the script and you want to do some investigating, here’s what I suggest doing.
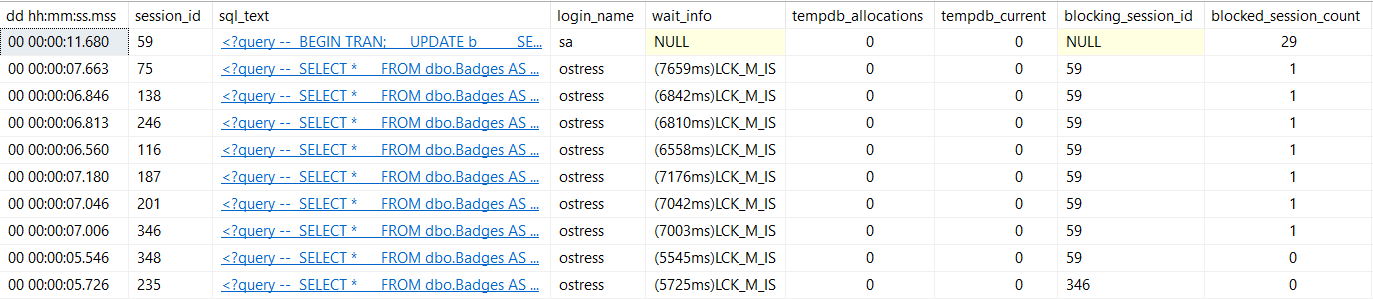
EXEC sp_WhoIsActive
    @show_own_spid = 1,
    @get_full_inner_text = 1;

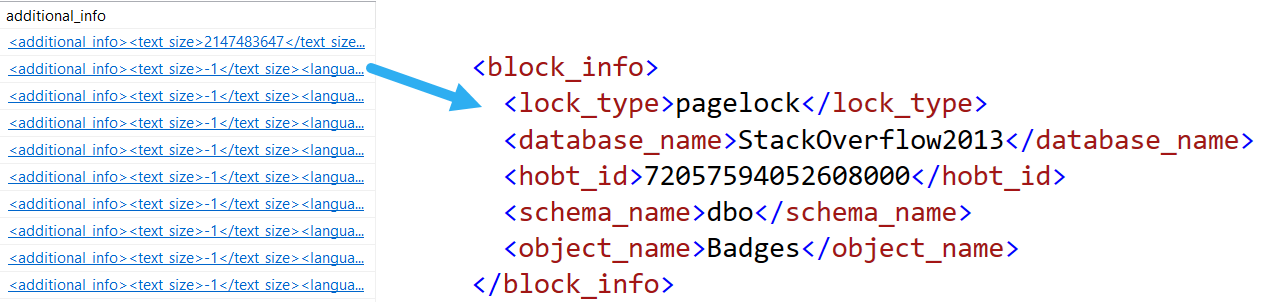
Run that along with any of the other parameters you’re using, and click on the sql_text column, that’ll give you the whole query that WhoIsActive runs. Paste that into a new SSMS window, and get rid of the XML artifacts like <?query -- and --?>.

After that, you’ll have to declare a few variables to make things run correctly:

DECLARE
    @i bigint = 922337203685477580,
    @recursion smallint = 1,
    @blocker bit = 0;


You’ll also wanna delete some of the header information that comes along:

(@recursion SMALLINT, @filter sysname, @not_filter sysname, @first_collection_ms_ticks BIGINT)DECLARE @blocker BIT;
SET @blocker = 0;
DECLARE @i INT;
SET @i = 2147483647;

After that, you can hit F5 and it’ll run. If your problem is in the main branch of the script that generates all the complicated dynamic SQL, that’ll help you figure out exactly where the problem is.

Thanks!

Going Further


If this is the kind of SQL Server stuff you love learning about, you’ll love my training. I’m offering a 75% discount to my blog readers if you click from here. I’m also available for consulting if you just don’t have time for that and need to solve performance problems quickly.

Starting SQL: Monitoring SQL Server Queries With sp_WhoIsActive

Starting SQL: Monitoring Active Queries With sp_WhoIsActive


Going Further


If this is the kind of SQL Server stuff you love learning about, you’ll love my training. I’m offering a 75% discount to my blog readers if you click from here. I’m also available for consulting if you just don’t have time for that and need to solve performance problems quickly.

Stressing tempdb and Observing Contention In SQL Server

Pssst!


If you landed here from Brent’s weekly links, use this link to get my training for 90% off.

The access is for life, but this coupon code isn’t! Get it while it lasts.

Discount applies at checkout, and you have to purchase everything for it to apply.

As Recently As Now


Even on SQL Server 2019, with in-memory tempdb metadata enabled, and an appropriate number of evenly sized data files, you can experience certain types of contention in tempdb.

It’s better. It’s definitely and totally better, but it’s still there. With that in mind, I wrote a stored procedure that you can stick in your favorite stress tool, to see how tempdb handles different numbers of concurrent sessions. You can download it here, on GitHub.

If you need a tool to run a bunch of concurrent sessions against SQL Server, my favorite two free ones are:

If you need tools to help you identify tempdb contention, the ones I use are:

Strikey


While I’m running one of those stress tools, this is how I use the stored procedures above to look for contention.

For sp_WhoIsActive, it’s really simple:

EXEC sp_WhoIsActive @get_task_info = 2;

The results will start to look like this when contention heats up. Again, things are a lot better now, but it can still happen.

sp_WhoIsActive
hello… you

For sp_HumanEvents, it’s still pretty simple:

EXEC dbo.sp_HumanEvents 
    @event_type = 'waits', 
    @seconds_sample = 10, 
    @wait_type = N'PAGELATCH_UP, PAGELATCH_EX, PAGELATCH_SH';

Since I want to specifically look for waits that indicate tempdb is mixing it up, I’ll put the most common PAGELATCH waits in.

SQL Server Query Results
cheesey plate

The output here is admittedly a bit truncated, because of limitations with the ring buffer extended event. But, you know, I think we can see enough.

If You See Contention


Check the basics first.

  • You might need more data files
  • Data files might be unevenly sized
  • If you’re on < SQL Server 2016, you might need trace flags 1117 and 1118
  • You might have a bunch of other stuff hemming up tempdb, too

Thanks for reading!

Going Further


If this is the kind of SQL Server stuff you love learning about, you’ll love my training. I’m offering a 75% discount to my blog readers if you click from here. I’m also available for consulting if you just don’t have time for that and need to solve performance problems quickly.

Reasons Your Query Is Slow Right Now: A Bad Query Plan Appears

Update Stats, They Said


Okay look, you probably should update stats. At least when you do it, you have some control over the situation.

If you let SQL Server get up to its own devices, you might become quite surprised.

One after-effect of updated stats is, potentially, query plan invalidation. When that happens, SQL Server might get hard to work coming up with a new plan that makes sense based on these new statistics.

And that, dear friends, is where things can go bad.

New Contributor ?


Let’s say we have this query, which returns the average post and comment score for a single user.

CREATE OR ALTER PROCEDURE dbo.AveragePostScore(@UserId INT)
AS
BEGIN
SET NOCOUNT, XACT_ABORT ON;

SELECT u.DisplayName, 
       AVG(p.Score * 1.) AS lmao_p,
       AVG(c.Score * 1.) AS lmao_c
FROM   dbo.Users AS u
JOIN   dbo.Posts AS p
    ON p.OwnerUserId = u.Id
JOIN   dbo.Comments AS c
    ON c.UserId = u.Id
WHERE u.Id = @UserId
GROUP BY u.DisplayName;

END;
GO

Most of the time, the query runs fast enough for the occasional run to not end too poorly.

But then a recompile happens, and a new contributor decides to look at their profile.

Okay To Worse


What comes next you could fill a textbook with.

EXEC dbo.AveragePostScore @UserId = 3150367;

A new plan gets compiled:

SQL Server Query Plan
wouldn’t get far

And you know, it looks great for a new user.

And you know, it looks not so great for a slightly more seasoned user.

SQL Server Query Plan
you shouldn’t have!

So What Changed?


Running the query first for a user with a bit more site history gives us a plan with a very different shape, that finishes in under 2 seconds. Repeating that plan for less experienced users doesn’t cause any problems. It finishes in very little time at all.

SQL Server Query Plan
JERN ERDR

The plan itself remains largely more familiar than most parameter sniffing scenarios wind up. There are plenty more similarities than differences. It really does just come down to join order here.

Alright, now we know what happened. How would we figure out if this happened to us IRL?

I Shot The Trouble


We can do what we did yesterday, and run sp_BlitzFirst. That’ll warn us if stats recently got updated.

EXEC sp_BlitzFirst @Seconds = 10, @ExpertMode = 1;

If we want to try to validate if that stats update messed with a plan, we can use sp_WhoIsActive:

EXEC sp_WhoIsActive @get_plans = 1, @get_avg_time = 1;

The get_avg_time parameter is one I’ve talked about before, and in this case it’s quite helpful.

We’ve got a bunch of queries that usually run in 0 seconds running for at least 20 seconds.

sp_WhoIsActive
bonked out

Fingerprinted


Since we used get_plans here too, we can grab the execution plan, and see which parameters were used on compilation and execution.

Get the properties of the select operator, either by right clicking and selecting properties, or hitting F4.

SQL Server Query Plan Properties
not yet

Now we know two things, and can test four things:

  • If we run this query using the compiled value, is it fast?
  • If we run this query using the runtime value, is it slow?
  • If we recompile and run it for the runtime value, is it fast or slow?
  • Is the compile time value still fast when it uses the “new” plan?

This is a little easier with stored procs, because you can do something like:

EXEC sys.sp_recompile @objname = N'dbo.AveragePostScore';

To use DBCC FREEPROCCACHE to target a specific query, you need the sql handle or plan handle. You don’t wanna jump off and clear the whole cache here, unless you’re desperate. Just make sure you understand that you might fix one query, and break others, if you clear the whole thing.

It’s better to be targeted when possible.

And of course, if you’ve got Query Store up and running, you may do well to look at Regressed or High Variance query views there, and force the faster plan.

Thanks for reading!

Going Further


If this is the kind of SQL Server stuff you love learning about, you’ll love my training. I’m offering a 75% discount to my blog readers if you click from here. I’m also available for consulting if you just don’t have time for that and need to solve performance problems quickly.

Reasons Your Query Is Slow Right Now: Blocking, Blocking, Blocking

Lockzilla


Blocking sucks. SQL Server should have used an optimistic isolation level by default.

Sure, writers would still block each other, but think of all the time people could have saved not explaining NOLOCK hints.

  • Yes, they still take locks
  • Yes, it’s the same as READ UNCOMMITTED
  • Yes, sometimes they make queries faster without blocking

Wait, what?

Moving Right Along


There are some interesting things to say about blocking, I suppose, aside from that it sucks.

For instance, it can look really weird when there’s parallelism. And read queries can block write queries.

There, I’ve said interesting things about blocking. It still sucks.

But how do you diagnose it?

First, close Activity Monitor.

Doctor, Doctor


My favorite tool for diagnosing blocking is sp_WhoIsActive, and I’m going to show you three different ways to look at it.

The safest way

EXEC sp_WhoIsActive @get_task_info = 2, @get_additional_info = 1;

This isn’t the way most people do it, but it is the least impactful.

You get back the normal set of results:

sp_WhoIsActive
peachy

Cool, you can see queries, lock waits, and blocking sessions. But a short scroll to the right also brings you to this additional_info clickable column:

sp_WhoIsActive
oily water

It’s not so helpful for the query doing the blocking, but it’ll tell you what the queries being blocked are stuck on.

The usual way

EXEC sp_WhoIsActive @get_locks = 1;

This is the way I normally demo looking for blocking with it, because it is more useful to see what the blocking query is doing.

But I’ve also had it be slow. Really, really slow.

That can happen when there is JUST SO MUCH BLOCKING that it takes a long time to enumerate all of it.

But you’ll get back this lovely sort of detail:

sp_WhoIsActive
say it loud

Page locks. 102. Great.

The smart way

EXEC sp_WhoIsActive @find_block_leaders = 1, @sort_order = '[blocked_session_count] DESC';

It’s not always obvious by runtime which session is causing blocking, so you can use this command to find blocking chains, and order output by who’s doing the most blocking.

sp_WhoIsActive
troubleshot

Fixins


When you need to troubleshoot live blocking, these are the ways I usually check in on things with sp_WhoIsActive. It’s hard to beat.

Of course, long term, a monitoring tool, or logging the blocked process report to a table can help you when you’re not there hitting F5 live and in-person.

We’ve peeled back a couple scenarios where oddball things can slow a server down. Tomorrow we’ll look at a new one!

What’ll it be?

Your guess is not as good as mine.

Thanks for reading!

Going Further


If this is the kind of SQL Server stuff you love learning about, you’ll love my training. I’m offering a 75% discount to my blog readers if you click from here. I’m also available for consulting if you just don’t have time for that and need to solve performance problems quickly.

Troubleshooting Parameter Sniffing In SQL Server With sp_WhoIsActive

THANKS ADAM


Going Further


If this is the kind of SQL Server stuff you love learning about, you’ll love my training. I’m offering a 75% discount to my blog readers if you click from here. I’m also available for consulting if you just don’t have time for that and need to solve performance problems quickly.

Underused sp_WhoIsActive capabilities: @delta_interval

Great Ghost


In the last post, we looked at how to see if your query is misbehaving, or if things are running normally.

Note that I didn’t say “good” here. Just normal.

For you.

What Have You Done For Me Lately?


Using sp_WhoIsActive in a slightly different way, we can see what a query has been up to over a duration of our choosing.

The delta columns are what happened over the span of time we pick. The columns that come back normally are cumulative to where the query is at now.

So for a 5 seconds interval:

EXEC sp_WhoIsActive @delta_interval = 5;
sp_WhoIsActive Results
Stacked

I’m stacking a couple screens shots from the normal single line of results, because they’re a little too wide all at once.

What deltas can help you figure out is how “active” your query really is.

In other words, it can answer the question: is my query stuck, or is my query doing something?

As an example, here’s a query that opened a transaction, ran an update, and then… sat there.

sp_WhoIsActive Results

Over all, we’ve done 4.4 million reads, 80k writes, and used about 7k ms of CPU.

But in the last five seconds, we haven’t done anything at all.

Thanks for reading!

Going Further


If this is the kind of SQL Server stuff you love learning about, you’ll love my training. I’m offering a 75% discount to my blog readers if you click from here. I’m also available for consulting if you just don’t have time for that and need to solve performance problems quickly.

Underused sp_WhoIsActive Capabilities For Troubleshooting SQL Server: @get_avg_time

Ablazemalls


Look, it’s impressive enough that sp_WhoIsActive works as well as it does. Most people who’ve been using it for a while are familiar with using @get_plans to retrieve query plans, or @get_locks to see locking information. I’m gonna spend a couple posts talking about less well known flags that I really like.

We’re gonna start off with one that can help you figure out if a particular query is misbehaving, or if things are just cruising along normally.

Nipples


I’ve got a stored procedure. What it does is unimportant. What’s important is that it’s sensitive to parameter sniffing.

We may not know this walking into an emergency, but we can figure it out pretty quickly using sp_WhoIsActive.

EXEC sp_WhoIsActive @get_avg_time = 1;
sp_WhoIsActive Results
Breathe Easy

This’ll give us back the usual information about how long our query has been running, but now right next to it is another column that ends in (avg).

When you use this switch, sp_WhoIsActive goes into the plan cache and looks at how long a particular query runs for on average.

If that number is much lower than how long the query has been running for, and it isn’t being blocked, you just might have a case of parameter sniffing on your hands.

Thanks for reading!

Going Further


If this is the kind of SQL Server stuff you love learning about, you’ll love my training. I’m offering a 75% discount to my blog readers if you click from here. I’m also available for consulting if you just don’t have time for that and need to solve performance problems quickly.

Lock Promotion In SQL Server Parallel Query Plans

I Don’t Always Talk About Locks


But when I do, it’s usually to tell people they should use RCSI, and then disappear in a cloud of smoke.

Recently I was thinking about lock promotion, because that’s what happens when I get lonely.

While digging around, I found some interesting stuff.

This is the part where I share it with you.

Without Five I Couldn’t Count To Six


The first thing I wanted was a table that I wouldn’t care about messing up, so I made a copy of the Users table.

SELECT *
INTO dbo.IDontCareAboutUsers
FROM dbo.Users AS u

ALTER TABLE dbo.IDontCareAboutUsers 
    ADD CONSTRAINT pk_IDontCareAboutUsers_id PRIMARY KEY CLUSTERED (Id);

Then I picked on a Reputation that only has one entry in the table: 20720.

BEGIN TRAN
UPDATE idcau
SET idcau.Reputation = 0
FROM dbo.IDontCareAboutUsers AS idcau
WHERE idcau.Reputation = 20720
OPTION(MAXDOP 4)

ROLLBACK

What followed was a full morning of wishing I paid more attention in internals class.

Number One


The first thing I found is that there were 16 attempts at promotion, and four successful promotions.

SQL Server query results in SQL Server Management Studio
4×4

Why did this seem weird? I dunno.

Why would there be only 4 successful attempts with no competing locks from other queries?

Why wouldn’t all 16 get promotions?

Number Two


Well, that’s a parallel plan. It’s running at DOP 4.

I added the hint in the update query above so I wouldn’t have to, like, do more to prove it.

A SQL Server Query Plan
Plantar

Okay, maybe this makes a little more sense. Four threads.

If each one tried four times, maybe another thread was like “nah, yo”, and then got by on the fifth try.

Number Three


Looking at perfmon counters before and after running showed.. exactly four!

SQL Server Perfmon Counters
Divisible
SQL Server Perfmon Counters
Still nowhere to go

Number Four


sp_WhoIsActive only showed single locks

SQL Server sp_WhoIsActive Locks
Hrm.

This isn’t wrong, necessarily. This is how things look in the DMVs it touches after the update runs, but the transaction is still open.

I’m not mad, but I am curious. I wanna know what happened in the middle.

Number Five


I set up a couple Extended Event sessions, one to capture locks acquired, and one to capture lock escalations.

This was neat.

SQL Server Extended Events Locks
Tell’em, picture

The red rectangle comes from locks acquired during the course of the update. You can see four separate threads going through and grabbing locks.

Each thread got the okay to escalate at 6,249 page locks.

Number Six


Lock promotion isn’t only denied when competing locks on the table are held by other queries.

Modification queries taking locks will attempt promotion every 1,250 locks.

Documentation regarding lock promotion points to at least 5,000 locks needing to be held before it occurs, as one factor (incompatible locks not being present are another).

If we have four threads asking every 1,250 locks (in this case on pages), they all will have made four attempts before finally escalating at 6,249.

6,249 / 1,250 is right around 5, for those who don’t have a calculator installed.

Don’t freak out if your monitoring tool tells you there’s a lot of attempts at escalation, and very few are successful.

It’s not always a sign that there’s blocking, though you may be able to correlate that with lock waits if both are present.

Thanks for reading!

Going Further


If this is the kind of SQL Server stuff you love learning about, you’ll love my training. I’m offering a 75% discount to my blog readers if you click from here. I’m also available for consulting if you just don’t have time for that and need to solve performance problems quickly.

Is The SQL Server Really Slower Than It Used To Be?

Economy Of Words


When someone says that something is slower than it was before, whether it’s a query, a whole SQL Server, a website, or an app screen, it’s almost never while the perceived slowness is happening, nor is it reproducible (especially when a consultant is watching).

There are some basic things you need to have historical record of if you wanna figure it out:

  • What queries were running
  • What queries were waiting on
  • What was different from last time those queries ran

Microsoft has taken some steps to help us figure this out with Query Store, but really only for SQL Server 2017, when aggregated wait stats were added to the family of Query Store views.

But if you’re like most people, you’re not on SQL Server 2017, and even further into that segment, you don’t have Query Store enabled.

I think there’s more Microsoft could do to improve data that’s collected, but right now it’s just a collection of votes.

Right now, the GUI is so limited in what you can search for that I wrote a sp_QuickieStore to make working with the data easier.

Compared To What?


If you’re on older versions of SQL Server, including those about to be taken off life support, what are your options?

For Free!

For Money!

There’s a whole landscape of SQL Server monitoring tools out there, as well as things people get confused with SQL Server monitoring tools.

Ultimately, the best monitoring tool for you is one you:

  • Will actually use
  • Will enable you to find problems
  • Will enable you to solve problems

Getting overwhelmed with meaningless metrics (there were how many logouts per second?!), standalone charts that don’t allow you to correlate system activity to resource usage (save as image?!), or long lists of queries that may or may not run when anyone cares (yes, CHECKDB did a lot of reads, thanks) doesn’t help anyone. If that sounds like your monitoring tool, it might be time to trade it for a carton of Gatorade.

You’ve got a glorified FitBit strapped onto your SQL Server.

Here And Now


What’s currently happening on your SQL Server is often only a symptom of what’s been happening on your SQL Server for a long time.

There are very few problems I’ve seen that are truly “sudden”, unless someone recently made an ill-advised change to the server, like dropping an important index, etc.

The longer you let things like aging hardware, growing data, and ignoring query and index problems go, the worse things get.

Monitoring your server is a good first step, but it’s still up to you to address the problems, and address the right problems.

Thanks for reading!

Going Further


If this is the kind of SQL Server stuff you love learning about, you’ll love my training. I’m offering a 75% discount to my blog readers if you click from here. I’m also available for consulting if you just don’t have time for that and need to solve performance problems quickly.