Using Views To Reduce Memory Grants In SQL Server

We All Have It


You know those tables, right? The ones where developers went and got lazy or didn’t know any better and decided every string column was going to be gigantic.

They may have read, of course, that SQL Server’s super-smart variable length data types only consume necessary space.

It’s free real estate.

Except it isn’t, especially not when it comes to query memory grants.

The bigger a string column’s defined byte length is, the bigger the optimizer’s memory grant for it will be.

Memory Grant Primer


In case you need some background, the short story version is:

  • All queries ask for some memory for general execution needs
  • Sorts, Hashes, and Optimized Nested Loops ask for additional memory grants
  • Memory grants are decided based on things like number of rows, width of rows, and concurrently executing operators
  • Memory grants are divided by DOP, not multiplied by DOP
  • By default, any query can ask for up to 25% of max server memory for a memory grant
  • Approximately 75% of max server memory is available for memory grants at one

Needless to say, memory grants are very sensitive to misestimates by the optimizer. Going over can be especially painful, because that memory will most often get pulled from the buffer pool, and queries will end up going to disk more.

Underestimates often mean spills to disk, of course. Those are usually less painful, but can of course be a problem when they’re large enough. In particular, hash spills are worth paying extra attention to.

Memory grant feedback does supply some relief under modern query execution models. That’s a nice way of saying probably not what you have going on.

Query Noogies


Getting back to the point: It’s a real pain in the captain’s quarters to modify columns on big tables, even if it’s reducing the size.

SQL Server’s storage engine has to check page values to make sure you’re not gonna lose any data fidelity in the process. That’ a nice way of saying you’re not gonna truncate any strings.

But if you do something cute like run a MAX(LEN(StringCol) and see what you’re up against, you can use a view on top of your table to assuage SQL Server’s concerns about such things.

After all, functions are temporary. Data types are forever (usually).

An easy way to illustrate what I mean is to look at the details of these two queries:

SELECT TOP (1000)
    p.Body
FROM dbo.Posts AS p
ORDER BY p.Score DESC
OPTION(RECOMPILE);

SELECT TOP (1000)
    Body = 
        CONVERT
        (
            nvarchar(100), 
            p.Body
        )
FROM dbo.Posts AS p
ORDER BY p.Score DESC
OPTION(RECOMPILE);

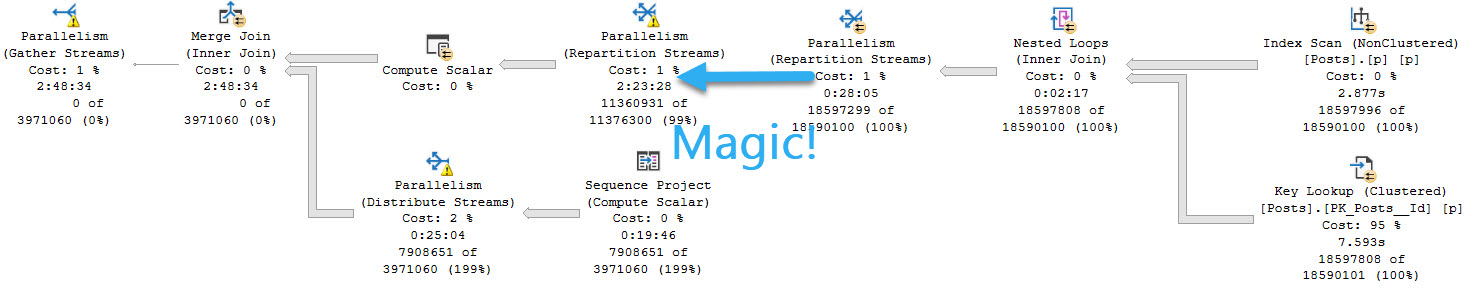
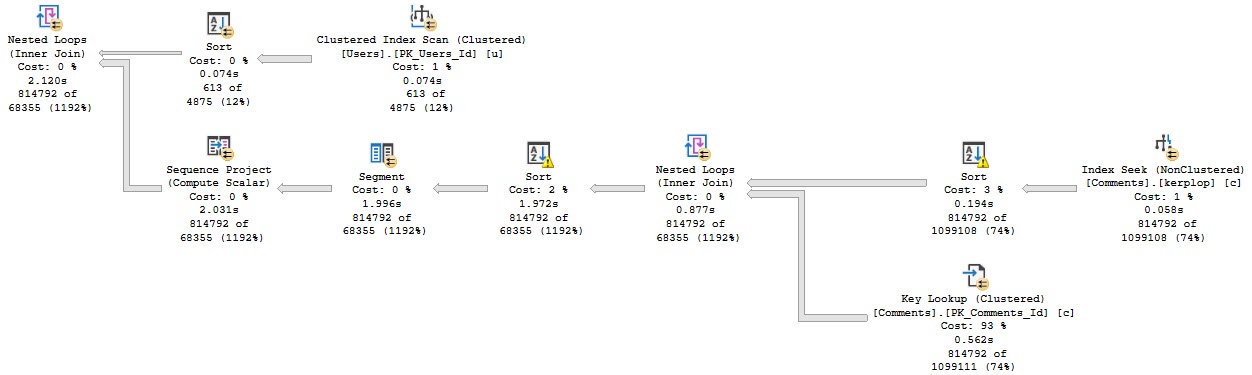
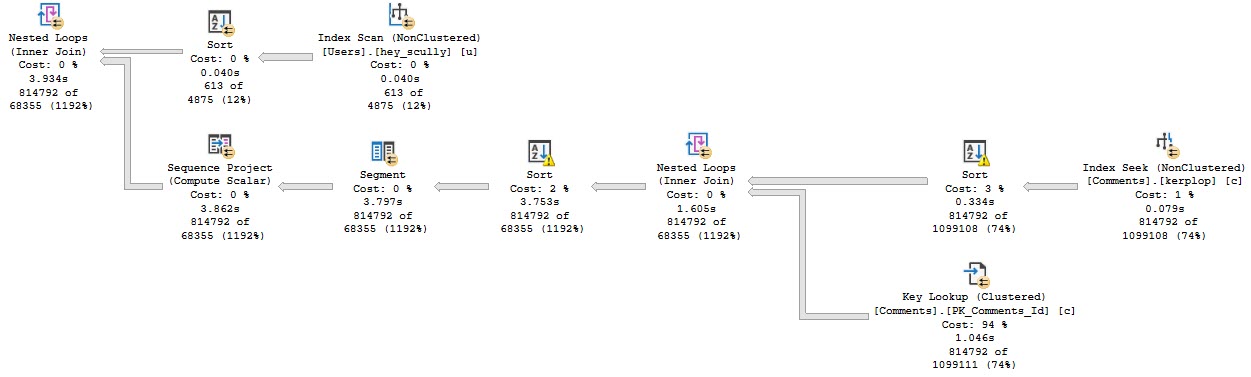
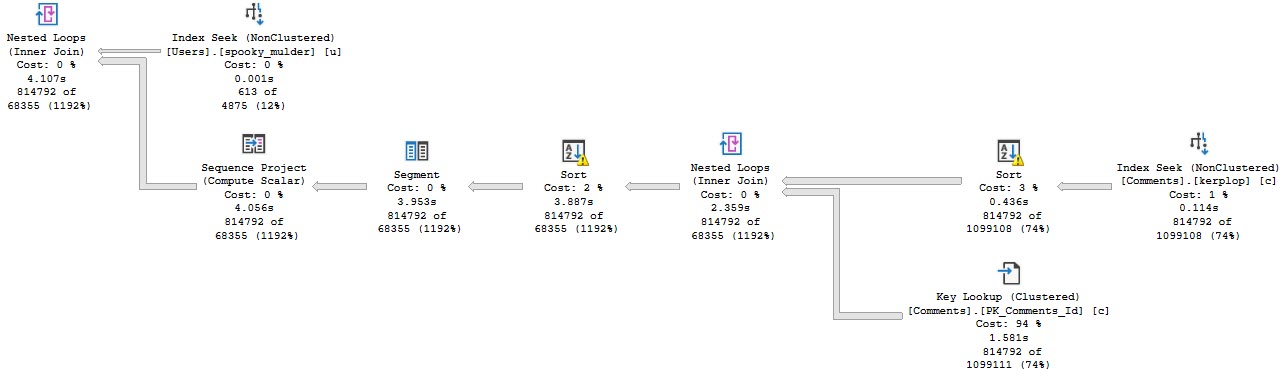
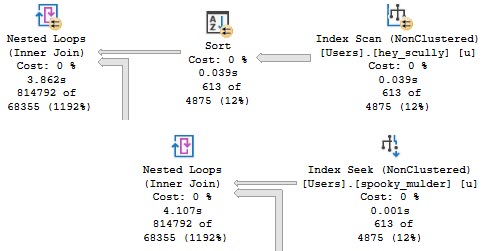
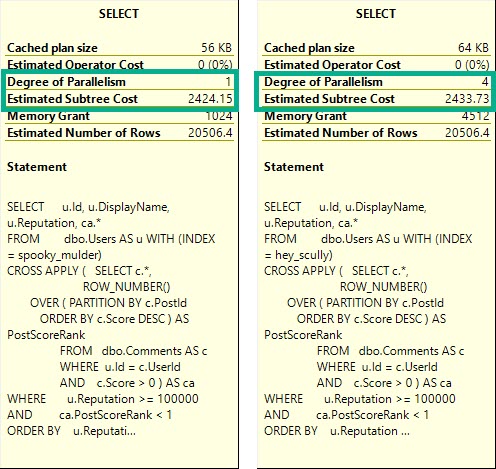
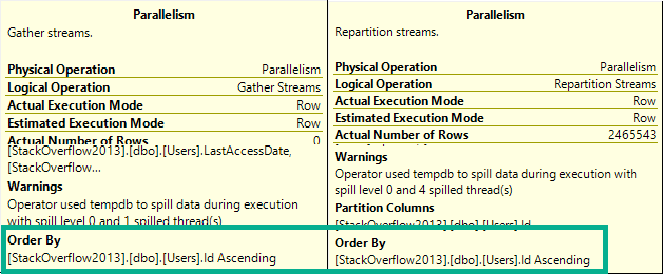
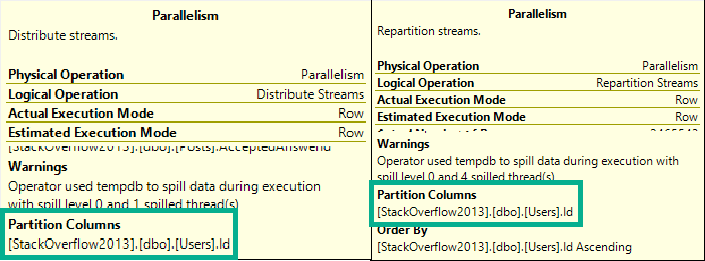
Some of this working is dependent on the query plan, so let’s look at those.

Pink Belly Plans


You can ignore the execution times here. The Body column is not a good representation of an oversized column.

It’s defined as nvarchar(max), but (if I’m remembering my Stack lore correctly) is internally limited to 30k characters. Many questions and answers are longer than 100 characters anyway, but on to the plans!

SQL Server Query Plan
janitor

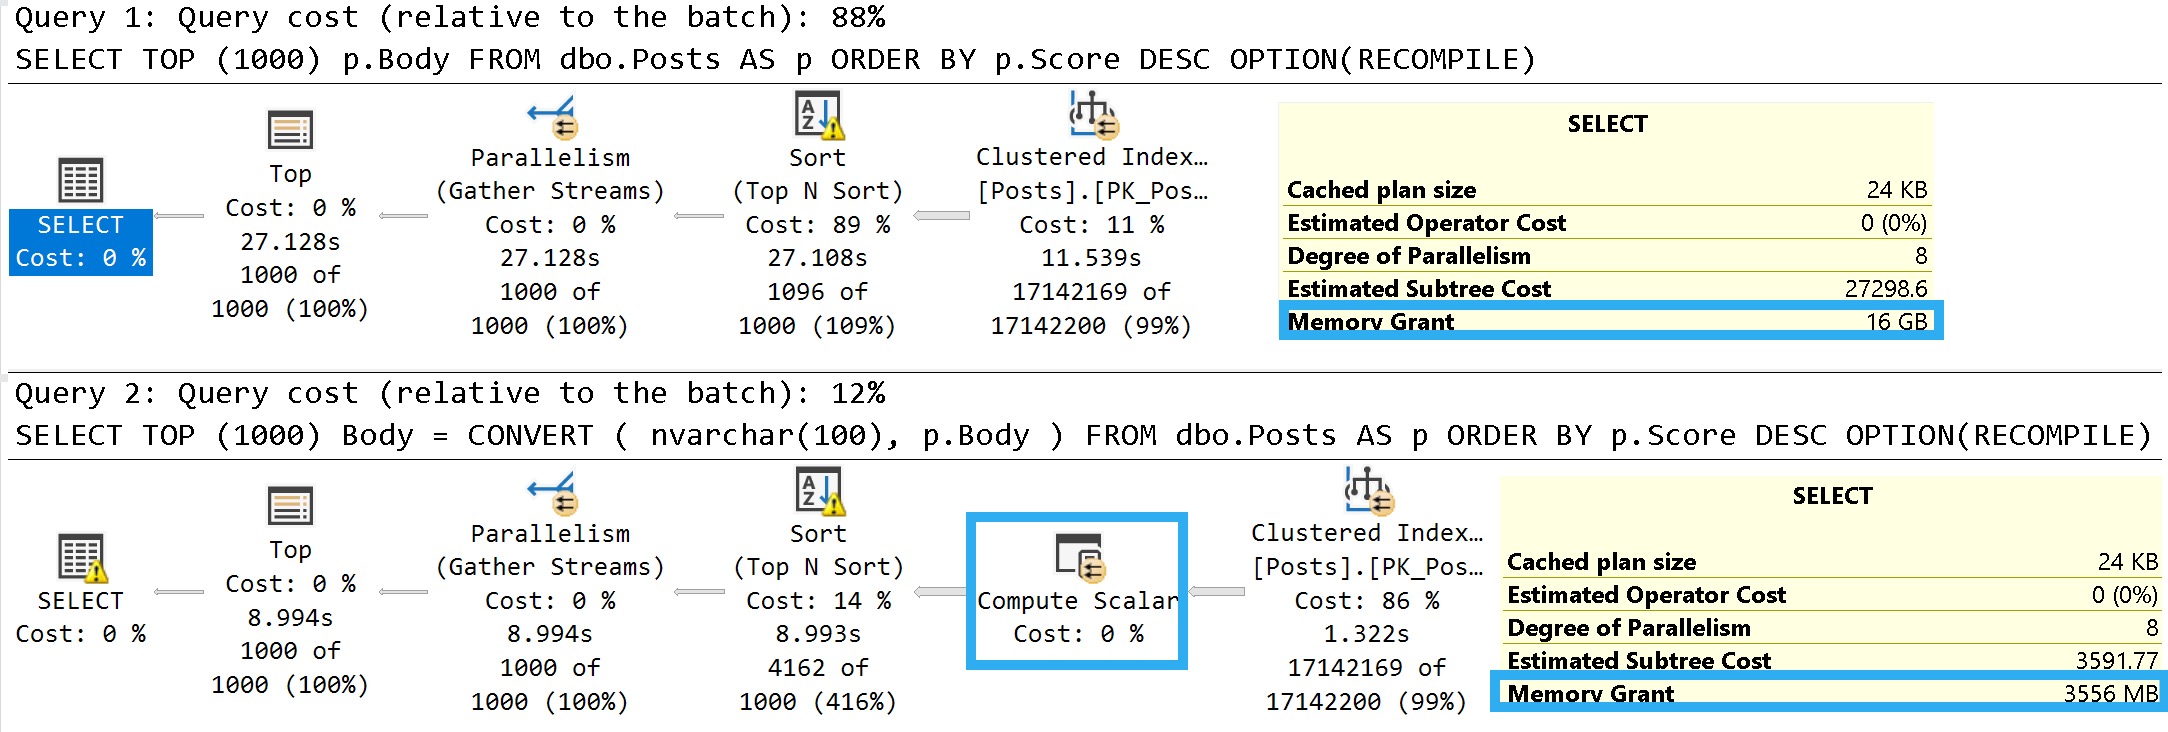
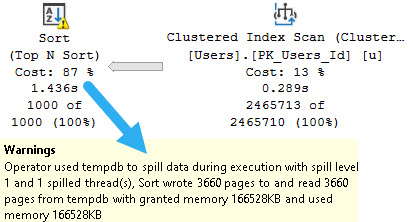
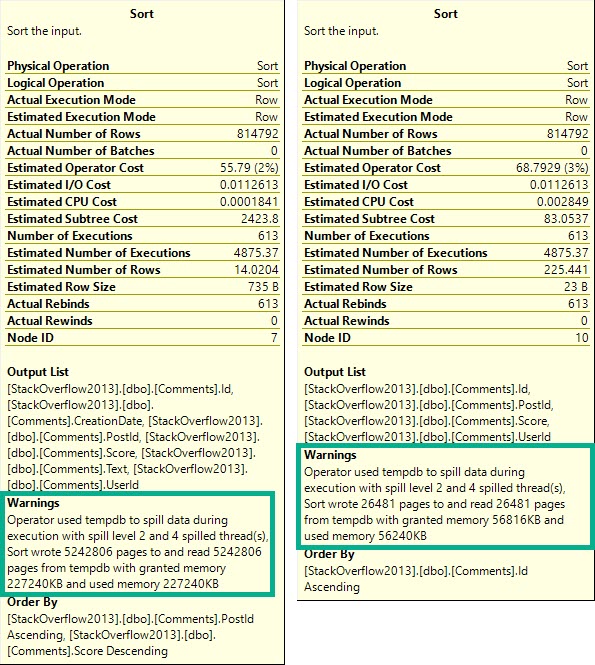
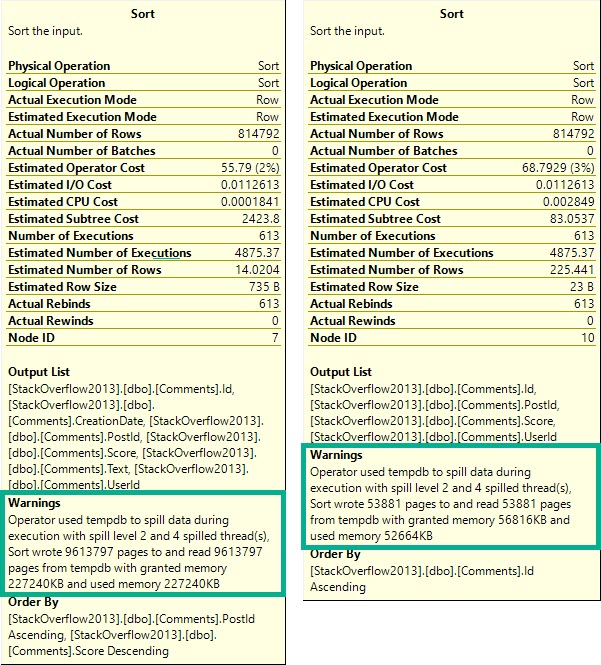
In the plan where the Body column isn’t converted to a smaller string length, the optimizer asks for a 16GB memory grant, and in the second plan the grant is reduced to ~3.5GB.

This is dependent on the compute scalar occurring prior to the Top N Sort operator, of course. This is where the convert function is applied to the Body column, and why the grant is reduced

If you were to build a view on top of the Posts table with this conversion, you could point queries to the view instead. That would get you the memory grant reduction without the pain of altering the column, or moving the data into a new table with the correct definition.

Thanks for reading!

Going Further


If this is the kind of SQL Server stuff you love learning about, you’ll love my training. I’m offering a 75% discount to my blog readers if you click from here. I’m also available for consulting if you just don’t have time for that and need to solve performance problems quickly.

When Query Spills Cause tempdb Contention And Performance Issues In SQL Server

Temptables


I was helping a client troubleshoot a scalability issue recently, where during one point in their workload tempdb went out of control.

What was puzzling them was that nothing in the stored procedure did anything with temporary objects, cursors, or any of the other obvious things that go to el baño público. And the query plan itself was a pretty simple little loopy thing.

It wasn’t until I grabbed a quick sample of actual execution plans with Extended Events that the problem became more obvious.

Despite the fact that the query was only passing around 7 rows, we were getting a one row estimate, and there was a spilling Sort operator.

Chance Of Cloudballs


There were a couple compounding issues here, of course, like that their database is hosted in the cloud.

It doesn’t matter which cloud you talk about, this is a problem they all have and I see people face constantly.

I/O sucks, up there.

It was a lot harder to get this to repro on my local hardware, because I have very nice drives.

Let’s take a look!

Bleak


If I run this query, it’ll spill a little bit. I have the MAXDOP 1 hint on there to artificially slow it down. Without that, the fast query and I/O make the contention harder to hit.

SELECT TOP (1000) 
    u.Id 
FROM dbo.Users AS u
ORDER BY u.Reputation
OPTION(MAXDOP 1);
SQL Server Query Plan
just like me

I stuck it in a stored procedure to make calling it from ostress a little bit easier.

No Return


After running for a bit, eventually we hit GAM contention:

SQL Server tempdb Contention
tuesday

We can see all the classic signs of tempdb contention, arising from spills.

It’s worth noting that enabling in-memory tempdb seems to alleviate this issue for the most part. I’d show you a picture of that, but it’s not worth 1000 words.

Fixing The Spill


Normally, I wouldn’t bother fixing a spill of that size, but in this case it was worthwhile because it was harming concurrency.

The quick fix was to add a MIN_GRANT_PERCENT hint. The long-term fix is to add an index to support the Sort operation.

Good ol’ indexes, putting data in order.

There are many reasons why a spill may occur. Poor estimates are quite common, but the reason for that poor estimate has about a billion potential root causes.

Even if your query gets enough memory, sometimes you may still see spills because certain operators had to share memory.

It’s a wild world.

Thanks for reading!

Going Further


If this is the kind of SQL Server stuff you love learning about, you’ll love my training. I’m offering a 75% discount to my blog readers if you click from here. I’m also available for consulting if you just don’t have time for that and need to solve performance problems quickly.

Wait Stats During Exchange Spills In SQL Server Parallel Query Plans

Inorganic


Lots of people say these are rare — and perhaps they are becoming more so — but I still see them with some frequency. That’s not a terribly strong indictment of SQL Server, but that’s not the point of this blog or of my work.

Exchange spills are particularly interesting, and I’ve written about them a couple times:

For each query we run, we’re gonna execute the query, and then this query to look at session level wait stats.

SELECT
    desws.*
FROM sys.dm_exec_session_wait_stats AS desws
WHERE desws.session_id = @@SPID
ORDER BY desws.wait_time_ms DESC;

Turns Out


The first thing to understand here is that the memory grant itself doesn’t matter. That’s why there’s no hint for it on this query, as there have been in the others.

WITH 
    precheck AS 
(
    SELECT
        u.Id, 
        p.Id AS PostId,
        p.AcceptedAnswerId,
        n = 
            ROW_NUMBER() OVER
            (
                ORDER BY
            	    u.Id
            )
    FROM dbo.Users AS u
    JOIN dbo.Posts AS p
        ON p.OwnerUserId = u.Id
    WHERE  u.CreationDate > '20110825' 
    AND    u.Reputation > 100 
    AND    p.PostTypeId = 1
)
SELECT 
    u.*, 
    p.*
FROM precheck p
JOIN dbo.Users AS u
    ON p.Id = u.Id
WHERE ISNULL(p.n, u.Id) = 0
ORDER BY u.Id, u.Reputation
OPTION(USE HINT('ENABLE_PARALLEL_PLAN_PREFERENCE'), MERGE JOIN);

We do need to ask for a parallel merge join, because parallel merge joins were a mistake and should not have optimizer support.

Thanks for watching.

Back Brain


The waits here are interesting. At the top, we have perhaps high expected waits on parallelism, because the spills are encountered at parallel exchanges.

SQL Server Query Plan
ouch

There are quite high waits on PAGEIOLATCH_EX, SLEEP_TASK, and SLEEP_BPOOL_STEAL rounding out the top five. This is quite interesting, because I’ve never explicitly thought of PAGEIOLATCH_EX waits in the context of exchange spills. Normally, I think of them when queries read pages from disk into memory for modification.

Going down the line, SLEEP_TASK is familiar from our time spent with hash spills, but SLEEP_BPOOL_STEAL is so far undocumented anywhere.

One can make some inferences based on the name about what it might be doing, but… It could also be a bit of a catch-all wait, like other waits that can be generated by spills.

From Me


Going further, the other interesting waits encountered here look like so:

SQL Server Query Plan
fields

If I had a Magic Eight Ball out right now, it’d probably just go into convulsions. Perhaps SLEEP_TASK (shown one above) is another clear sign of a different kind of spill, but there’s so much else going on here it’s hard to tell for certain which waits this query generated were from the spill, and which were from other portions of the query executing regularly.

Points for hitting PREEMPTIVE waits, though.

To You


You weren’t mis-reading when you saw the query plan. This really did execute for over two hours. I tried to get another exchange spill into the mix by changing the query slightly, but all I got was a very cranky Repartition Streams.

WITH 
    precheck AS 
(
    SELECT
        u.Id, 
        p.Id AS PostId,
        p.AcceptedAnswerId,
        p.Body, --New
        n = 
            ROW_NUMBER() OVER
            (
                ORDER BY
            	    u.Id
            )
    FROM dbo.Users AS u
    JOIN dbo.Posts AS p WITH(INDEX = p)
        ON p.OwnerUserId = u.Id
    WHERE  u.CreationDate > '20110825' 
    AND    u.Reputation > 100 
    AND    p.PostTypeId = 1
)
SELECT 
    u.*, 
    p.*
FROM precheck p
JOIN dbo.Users AS u
    ON p.Id = u.Id
WHERE ISNULL(p.n, u.Id) = 0
ORDER BY u.Id, u.Reputation
OPTION(USE HINT('ENABLE_PARALLEL_PLAN_PREFERENCE'), MERGE JOIN);

And it ran for an extra 45 or so minutes, too.

SQL Server Query Plan
discard


Ugly Baby


The results for this second query wait stats wise are just an amplified version of the original, of course.

SQL Server Wait Stats
gun tricks

Obviously dragging the Body column around had a rather profound influence on things.

Whole And Wet


These waits are perhaps less obvious than other spills, though one could make reasonable assumptions about SLEEP_TASK waits here as well.

I’d be concerned about any query emitting high amounts of it, or any server with high amounts of it compared to uptime.

It seems unfortunate that there’s no wait directly tied to hash spills, but perhaps when we’re all living in some quantum batch mode reality in the cloud it won’t matter at all.

Thanks for reading!

Going Further


If this is the kind of SQL Server stuff you love learning about, you’ll love my training. I’m offering a 75% discount to my blog readers if you click from here. I’m also available for consulting if you just don’t have time for that and need to solve performance problems quickly.

Wait Stats During Hash Spills In SQL Server Query Plans

Jam Job


Hash spills are, as we’ll see, sometimes identified by a different wait than sort spills. In small quantities, spills are often not worth bothering with. But when they pile up, they can really cause some severe performance issues.

In this post, I want to show that both Hash Aggregates and Joins can cause the same wait type, along with some evidence that strings make things worse.

In all the queries, I’m going to be using the MAX_GRANT_PERCENT hint to set the memory grant ridiculously low, to make the waits I care about stick out.

For each query we run, we’re gonna execute the query, and then this query to look at session level wait stats.

SELECT
    desws.*
FROM sys.dm_exec_session_wait_stats AS desws
WHERE desws.session_id = @@SPID
ORDER BY desws.wait_time_ms DESC;

Merch Pants


First up, a highly doctored hash aggregate:

SELECT   
    c.CreationDate, 
    c.PostId, 
    c.Score, 
    c.UserId
FROM dbo.Comments AS c
GROUP BY 
    c.CreationDate, 
    c.PostId, 
    c.Score, 
    c.UserId
HAVING COUNT_BIG(*) > 2147483647 
OPTION(HASH GROUP, QUERYRULEOFF GenLGAgg, MAX_GRANT_PERCENT = 0.0);

But the important thing here is that there are no strings involved.

SQL Server Query Plan
clean

The spill goes on for about two minutes and twenty seconds, in row mode, at DOP 8.

That sure is bad, but in the words of Sticky Fingaz: Bu-bu-bu-but wait it gets worse.

Foolproof Plan


Let’s pull out another highly doctored hash aggregate, this time with our friend the Text column.

SELECT   
    c.CreationDate, 
    c.PostId, 
    c.Score, 
    c.Text, 
    c.UserId
FROM dbo.Comments AS c
GROUP BY 
    c.CreationDate, 
    c.PostId, 
    c.Score, 
    c.Text, 
    c.UserId
HAVING COUNT_BIG(*) > 2147483647 
OPTION(HASH GROUP, QUERYRULEOFF GenLGAgg, MAX_GRANT_PERCENT = 0.0);

We see more of our friend SLEEP_TASK. Again, many other things may add to this wait, but holy hoowee, this is hard to ignore.

SQL Server Query Plan
intro

That’s a solid — heck, let’s just call it 18 minutes — of spill time. That’s just plain upsetting.

Filthy.

And Join


Causing the same problem where a Hash Join is in play will exhibit the same wait.

SELECT 
    c.*
FROM dbo.Votes AS v
LEFT JOIN dbo.Comments AS c
    ON v.PostId = c.PostId
WHERE ISNULL(v.UserId, c.UserId) > 2147483647
OPTION(MAX_GRANT_PERCENT = 0.0);
SQL Server Query Plan
jacket, no shirt

Now we get stuck spilling for about 21 minutes, which is also awkward and uncomfortable.

Funkel


We’ve looked at sort spills being the cause of IO_COMPLETION waits, and hash spills being the cause of SLEEP_TASK waits.

Again, if you see a lot of these waits on your servers, you may want to check out the query here to find plans in the cache that are selects that cause writes, for reasons explained in the linked post.

Tomorrow we’ll wake up bright and early to look at which waits crop up during exchange spills.

Thanks for reading!

Going Further


If this is the kind of SQL Server stuff you love learning about, you’ll love my training. I’m offering a 75% discount to my blog readers if you click from here. I’m also available for consulting if you just don’t have time for that and need to solve performance problems quickly.

Wait Stats During Sort Spills In SQL Server Query Plans

Over Under


Over the next few days, I’m going to look at the wait stats that show up during different types of spills of different sizes. For no reason whatsoever, I’m going to start with sort spills. I’ll also cover hash and exchange spills, in case you were wondering just how long you’d have to sit here reading about them.

The point is not that spills are the sole things that cause these waits, it’s just to give you some things to potentially watch out for if you see these waits piling up and can’t pin down where they’re coming from.

In all the queries, I’m going to be using the MAX_GRANT_PERCENT hint to set the memory grant ridiculously low to make the waits I care about stick out.

For each query we run, we’re gonna execute the query, and then this query to look at session level wait stats.

SELECT
    desws.*
FROM sys.dm_exec_session_wait_stats AS desws
WHERE desws.session_id = @@SPID
ORDER BY desws.wait_time_ms DESC;

No Strings Attached


Strings are horrible. The bigger they are, they worse they are. Nearly every time I see oversized string columns, I see them causing problems.

File that under obvious foreshadowing while we look at a sort that doesn’t involve any strings.

SELECT 
    c.Id, 
    c.CreationDate, 
    c.PostId, 
    c.Score, 
    c.UserId
FROM 
(
    SELECT 
        c.Id, 
        c.CreationDate, 
        c.PostId, 
        c.Score, 
        c.UserId,
        n = 
            ROW_NUMBER() OVER 
            ( 
                ORDER BY 
                    c.PostId DESC 
            )
    FROM dbo.Comments AS c
) AS c
WHERE c.n = 0
OPTION(MAX_GRANT_PERCENT = 0.0);

This query executes at DOP 8 in row mode, and the primary wait that racks up is IO_COMPLETION.

SQL Server Query Plan
big hands

Strings Attached


Remember when I told you to file that thing up there under another thing? Here’s why.

In this query, we’re also going to select the Text column from the Comments table , which is an nvarchar(700).

SELECT 
    c.Id, 
    c.CreationDate, 
    c.PostId, 
    c.Score, 
    c.Text, --New
    c.UserId
FROM 
(
    SELECT 
        c.Id, 
        c.CreationDate, 
        c.PostId, 
        c.Score, 
        c.Text, --New
        c.UserId,
        n = 
            ROW_NUMBER() OVER 
            ( 
                ORDER BY 
                    c.PostId DESC 
            )
    FROM dbo.Comments AS c
) AS c
WHERE c.n = 0
OPTION(MAX_GRANT_PERCENT = 0.0);

In this case, things get way worse. If you’re surprised, you should try reading blog posts; particularly this one.

SQL Server Query Plan
a-heh-hem

Rather than ~16 seconds of spilling, we end up with a bit over four minutes of spilling. This is as the Mayans foretold, but the 2012 calendar was drunk and got the last two digits backwards.

Incomplete


Again, there are many potential causes of this wait, but on servers where I see them really piling up and ending up in top waits, there tends to be a dearth of memory and a lot of queries spilling to disk during sorts.

If you see this wait piling up, you may want to check out the query here to look for select queries that cause writes, which can indicate spills (among other things).

Thanks for reading!

Going Further


If this is the kind of SQL Server stuff you love learning about, you’ll love my training. I’m offering a 75% discount to my blog readers if you click from here. I’m also available for consulting if you just don’t have time for that and need to solve performance problems quickly.

Signs Your SQL Server Execution Plan Is Lying To You: Spills and Memory Grants

Milky


Going Further


If this is the kind of SQL Server stuff you love learning about, you’ll love my training. I’m offering a 75% discount to my blog readers if you click from here. I’m also available for consulting if you just don’t have time for that and need to solve performance problems quickly.

Signs Your SQL Server Execution Plan Is Lying To You: Exchange Spills

Since They Wanna Know


Going Further


If this is the kind of SQL Server stuff you love learning about, you’ll love my training. I’m offering a 75% discount to my blog readers if you click from here. I’m also available for consulting if you just don’t have time for that and need to solve performance problems quickly.

Why Spills In SQL Server Parallel Plans Can Hurt Performance

Go Along, Get Along


This is a somewhat complicated topic. There’s not a great TL;DR here, but I don’t want anyone to walk away from this post thinking that parallelism or indexes are “bad”.

What I do want to show is how uneven parallelism can exacerbate existing plan quality issues, and how some indexing can be unhelpful.

Query The First


This is the query we’ll be working with.

SELECT      u.Id, u.DisplayName, u.Reputation, ca.*
FROM        dbo.Users AS u WITH
CROSS APPLY (   SELECT c.*, 
                       ROW_NUMBER() 
					       OVER ( PARTITION BY c.PostId 
						          ORDER BY c.Score DESC ) AS PostScoreRank
                FROM   dbo.Comments AS c
                WHERE  u.Id = c.UserId
                AND    c.Score > 0 ) AS ca
WHERE       u.Reputation >= 100000
AND         ca.PostScoreRank < 1
ORDER BY    u.Reputation DESC
OPTION(RECOMPILE);

I’m using cross apply because the optimizer is likely to pick a Nested Loops join plan. These plans are unlikely to see a Redistribute Streams on the inner side of the join.

Within the apply, I’m making SQL Server do a more significant amount of work than outside of it. This will make more sense later on.

Outside of the apply, I’m doing a little bit of work against a few columns in the Users table, columns that would probably make good candidates for indexing.

The index that I currently have on the Comments table looks like this:

    CREATE INDEX kerplop 
    ON dbo.Comments(UserId, PostId, Score DESC) 
    WHERE Score > 0

Anyway, the query plan for this run looks like this:

SQL Server Query Plan
Stevenage overspill

The part I want to focus on are the spills.

SQL Server Query Plan
Goes on…

What you should keep in mind is that while all 4 threads spill, they all spill pretty evenly.

Thread distribution is pretty good across parallel workers. Not perfect, but hey.

All together now

If you want perfect, go be disappointed in what you get for $47k per .75 cores of Oracle Enterprise Edition.

Query The Second


Knowing what we know about stuff, we may wanna add this index:

    CREATE UNIQUE INDEX hey_scully
    ON dbo.Users (Id, Reputation DESC) 
    INCLUDE(DisplayName);

But when we do, performance gets much worse.

SQL Server Query Plan
If only.

Zooming back in on the Sorts…

SQL Server Query Plan
Happening in mine.

Each spill was about ~2x as bad, because thread distribution got much worse.

SQL Server Query Plan
Fall down

Poor thread 4 got stuck with ~534k rows. The problem here is that each thread in a parallel plan gets an even cut of the memory grant. That doesn’t rebalance if parallelism is skewed. Threads may rebalance if a Redistribute Streams operator appears, but we don’t have one of those here. We will sometimes get one on the outer side of nested loops joins, if the optimizer decides it’s needed.

But since we don’t, things get all screwy.

SQL Server Query Plan
Underage

Thread 2, which had only 63k rows assigned to it didn’t use the full amount of memory it got, though it still apparently spilled. Same with thread 3, but to a lesser extent (get it?).

But why did this happen when we added an index?

Paper Boy


Reading the plan from right to left, top to bottom, we start with a scan of the Users table. This is when something called the parallel page supplier kicks in and starts handing out rows as threads ask for them. Its job is to make sure that parallel workers get rows when they ask for them, and that different threads don’t get the same rows. To do that, it uses key ranges from the statistics histogram.

It makes for a rather dull screenshot, but both histograms are identical for the clustered and nonclustered indexes in this demo. It’s not a statistical issue.

Nor are indexes fragmented, so, like, don’t get me started.

According to my Dear Friend, the parallel page supplier aims for 64k chunks. The smaller index just happens to end up with a more unfortunate key range distribution across its fewer pages.

Feuer

What About A Different Index?


Let’s switch our indexes up and add this one:

    CREATE UNIQUE INDEX spooky_mulder
    ON dbo.Users (Reputation DESC, Id) 
    INCLUDE(DisplayName);

The plan no longer goes parallel, and it runs for about 4 seconds.

SQL Server Query Plan
First Resort, Last Resort

We’re doing the same amount of work on the inner side of the nested loops join. The only part of the plan that changed is on the outer side.

SQL Server Query Plan
Monkey Bread

This is more of an aside than anything, but in parallel nested loops plans, the optimizer only considers if parallelism will reduce the cost of the outer side of the join.

The plan changing to use a cheaper seek with no need to sort data means the outer side is rather cheap to execute, but the inner side is just as expensive.

SQL Server Query Plan
Not to brag but

The DOP 1 plan is only slightly cheaper, here. You may expect a plan that “costs” this much to go parallel, but alas, it was not meant to be.

Thanks for reading!

Going Further


If this is the kind of SQL Server stuff you love learning about, you’ll love my training. I’m offering a 75% discount to my blog readers if you click from here. I’m also available for consulting if you just don’t have time for that and need to solve performance problems quickly.

Spills Week: How Exchange Spills In Parallel Query Plans Crush Query Performance

Many Have Entered, Few Have Left


For some background on Exchange Spills, check out this Great Post™ by Joe.

The root of this demo was trying to show people silly things about CTEs, how TOP can fence things off, and how TOP introduces a serial zone in plans unless it’s used inside the APPLY operator.

The result was this magnificent beast.

Long Mane


Why is this magnificent?

Because we have the trifecta. We have a spill on all three types of parallel exchanges.

SQL Server Query Plan
It’s not gonna work out

Let’s take a closer look at those beauties.

SQL Server Query Plan
*slaps hood*

Why Did That Happen?


This plan has a Merge Join, which requires ordered input.

That means the Repartition and Gather Streams operators preserve the order of the Id column in the Users table.

SQL Server Query Plan
News Of The World

They don’t actually order by that column, they just keep it in order.

But what about Distribute Streams? GREAT QUESTION!

SQL Server Query Plan
Legalize Burberry

It has the same Partition Column as Repartition Streams. They both have to respect the same order going into the Merge Join, because it’s producing ordered output to the Gather Streams operator.

In short, there’s a whole lot of buffers filling up while waiting for the next ordered value.

Were Parallel Merge Joins A Mistake?


[Probably] not, but they always make me nervous.

Especially when exchange operators are the direct parent or child of an order preserving operator. This also goes for stream aggregates.

I realize that these things are “edge cases”. It says so in the documentation.

The Exchange Spill event class indicates that communication buffers in a parallel query plan have been temporarily written to the tempdb database. This occurs rarely and only when a query plan has multiple range scans… Very rarely, multiple exchange spills can occur within the same execution plan, causing the query to execute slowly. If you notice more than five spills within the same query plan’s execution, contact your support professional.

Well, shucks. We only have three spills. It looks like we don’t qualify for a support professional.

Thanks for reading!

Going Further


If this is the kind of SQL Server stuff you love learning about, you’ll love my training. I’m offering a 75% discount to my blog readers if you click from here. I’m also available for consulting if you just don’t have time for that and need to solve performance problems quickly.

Spills Week: How Hash Join Spills Hurt SQL Server Query Performance

Thirsty Thursday


If you’ve made it this far, you’ve learned a few things:

  • Not all spills are worth trying to fix
  • The more columns you select, the worse spills get
  • The larger your string datatypes are, the worse spills get

Today’s post won’t prove much else different from those things, but follow along if you’re interested.

Batter Up


Our first example looks like this:

SELECT v.*
FROM dbo.Votes AS v
LEFT  JOIN dbo.Comments AS c
ON v.PostId = c.PostId
WHERE ISNULL(v.UserId, c.UserId) > 2147483647;

We’re joining Votes to Comments with kind of a funny where clause, again.

This’ll force us to join both tables fully together, and then filter things out at the end.

Maximum Bang For Maximum Buck.

With no restrictions, this query runs for about 18 seconds with a 4.6GB memory grant.

SQL Server Query Plan
Stolen wine

If we restrict the memory grant to 10MB, it runs for around 30 seconds. The spill is fairly large, too: 600k pages.

SQL Server Query Plan
Paul White Likes Cowbells

Dropping it down to 4.5MB follows a similar pattern. I told you. No surprises. Easy reading.

SQL Server Query Plan
Slightly less good, eh?

Spill level 6. 1.4mm pages. Runs for a minute eighteen.

It’s almost like memory is kind of a big deal for SQL Server, huh?

That might be something to consider the next time you look at the size of your data in relation to the amount of memory that pesky VM admin swears is “enough” for SQL server.

Home Team


Our first query was selecting all the columns from the Votes table.

This time, we’re gonna select everything from the Comments table, including that pesky NVARCHAR 700 column.

SELECT c.*
FROM dbo.Votes AS v
LEFT  JOIN dbo.Comments AS c
ON v.PostId = c.PostId
WHERE ISNULL(v.UserId, c.UserId) > 2147483647;
SQL Server Query Plan
Get in loser

About 22 seconds, with a 9.7GB memory grant.

If you recall up a little further, when we just selected the columns from Votes, the grant was 4.6GB.

Still big, but look at those string columns inflating things again. Golly and gosh.

With a 10MB grant, we shoot right to nearly 2 minutes.

SQL Server Query Plan
DEAR LORD

If you’re keeping score at home, bloggers are very patient people.

SQL Server Query Plan
My, my, my

That’s 4:32 of my life that I’m never getting back. And I have to waste it again because I forgot to look at the hash bailout extended event for this.

There we are.

SQL Server Extended Events
I’m bailing out of finishing this post tonight.

That represents a significant performance degradation.

Ahem.

Tomorrow, we’ll look at Exchange Spills, which represent an even worse one.

Thanks for reading!

Going Further


If this is the kind of SQL Server stuff you love learning about, you’ll love my training. I’m offering a 75% discount to my blog readers if you click from here. I’m also available for consulting if you just don’t have time for that and need to solve performance problems quickly.