Of Walls And Clocks
No one ever says a broken record is right twice a day, perhaps because DJs are far more replaceable than clock makers.
I say that only to acknowledge that I may sound like a broken record when I say that when you’re tuning a query, it’s quite important to compare wall clock time and duration. Things you should note:
- If CPU and duration were about equal in a serial plan, that’s normal
- If CPU is much higher than duration in a parallel plan, that’s normal
- If duration and CPU are about equal in a parallel plan, you’ve got yourself a situation
- If duration is much higher than CPU in any plan, something else held your query up
In this post, I’m going to outline a non-exhaustive list of reasons why that last bullet point just might be.
Hammer Time
Big Data: One common reason you may run into is that you’re returning a large result set, either locally to SSMS, or to an app server that is either overloaded or underpowered. It’s also possible that something is happening on the application side that’s slowing things down. In these cases, you’ll usually see a lot of ASYNC_NETWORK_IO waits. To better test the speed of the actual query, you can dump the results into a #temp table.
Blocking: Another quite common issue is that the query you’re running is getting blocked. Before you go reaching for that NOLOCK hint, make sure you know what it does. Blocking is each to check on with sp_WhoIsActive. If you see your query waiting on waits that start with LCK_ Some common ones are LCK_M_SCH_S, LCK_M_SCH_M, LCK_M_S, LCK_M_U, LCK_M_X, LCK_M_IS, LCK_M_IU, LCK_M_IX. While your query is being blocked, it’s just gonna rack up wall clock time, while using zero CPU.
Stats updates: Once in a while I’ll run into a query that runs slowly the first time and fast the second time because behind the scenes the query had to wait on stats to update. It’s a bit hard to figure out unless you’re on SQL Server 2019, but it can totally make your query look like you sat around doing nothing for a chunk of time, especially if you’re waiting on large tables, or a bunch of smaller updates.
Reading from disk: If the tables or indexes you’re reading are bigger than your buffer pool, your queries are gonna eat it going to disk to read data in. If this is your limitation, you’ll see a lot of PAGIOLATCH_SH or PAGEIOLATCH_EX waits, depending on if your query is reading data, writing data, or both.
Waiting for a worker thread: When your queries can’t get a worker thread to run on, they end up waiting on THREADPOOL. While some waits on it are to be expected, you don’t want queries to wait long periods of time on this. It’s a serious sign your server is jammed way up.
Waiting for memory: When your queries can’t get the memory grant they want, they sit around waiting on RESOURCE_SEMAPHORE. Just like above, it’s a sure sign your server is having problems if it’s a wait you see occurring a lot, or for long average periods of time.
Waiting for a query plan: I know, this sounds like a long compilation time — and it sort of is — but only because the query is waiting a long time to get memory to compile an execution plan. This wait is going to be RESOURCE_SEMAPHORE_QUERY_COMPILE, instead.
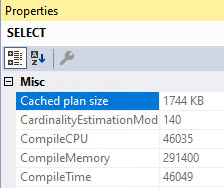
Query Plan Compilation: Sometimes the optimizer gets a bit carried away and spend a whole bunch of time in search2 trying to reorder joins, and do other tricks to make your query faster. Under extreme circumstances, you might wait a really long time for that query plan. There’s no wait stats to tell you that, but if you look at your query plan’s properties (F4 key on the root operator), you can see the compile time.
Thanks for reading!
Going Further
If this is the kind of SQL Server stuff you love learning about, you’ll love my training. I’m offering a 75% discount to my blog readers if you click from here. I’m also available for consulting if you just don’t have time for that and need to solve performance problems quickly.
You made me crack up laughing with that first statement.
It would be curious to see how the same scenario applies to SQL Server 2012, 2014, 2016, 2017, 2019…
Do you think downgrading/upgrading the Compatibiliy Level will change the outcome?
For most of these scenarios, probably not. Perhaps some of the parallelism stuff if you get batch mode on row store.
This is very informative, thank you for the post.