One For The Money
This post describes a little more of the philosophy behind sp_PressureDetector more than anything technical about it. Maybe.
I write this at the outset, but who knows where it’ll end up. Might even delete the whole thing and look at expensive cheese.
ANYWAY! If you’ve been following my posts this week, you’ll be painfully aware that sp_PressureDetector looks at things in your SQL Server that could indicate CPU or memory pressure.
Of course, very few servers will experience either of those issues without queries running, and so my dear friend sp_PressureDetector will show you which queries are in the danger zone.
And since it may be different queries causing problems, I show you two different sets of queries in two different ways.
Two For The Memory
The memory grant section shows you queries ordered by highest current memory grant. It will show you stuff you’re accustomed to, like session id, database, query text, query plan, and all that stuff, but it’ll also break down important stuff about what’s going on with memory.

There are four queries running on my demo VM. Three of them asked for and received memory grants, but one of them didn’t!
- The first three queries have all requested and been granted memory and are slowly using it
- The fourth query hasn’t gotten a grant yet, but is sitting in a queue waiting for memory to free up
While that fourth query waits for memory, it’s sitting around on RESOURCE_SEMAPHORE.
You may not always see this happening, but even without hitting the global limit for memory grants, you can still get pretty valuable data about queries running asking for memory.
Three To Get CPU Ready
Just like the memory grant query output, the CPU section will show you familiar and helpful columns to identify and analyze the query, but the section that will show you which ones are chewing up CPU is here:

In this cap, there are five queries running (all of them are parallel). You can see associated waits, cpu time, elapsed time, and other resource usage.
You can also see just how parallel a query went. Because there is only one “branch” in this query plan, DOP and parallel worker count are equal. In larger plans, worker count can be a multiple of DOP.
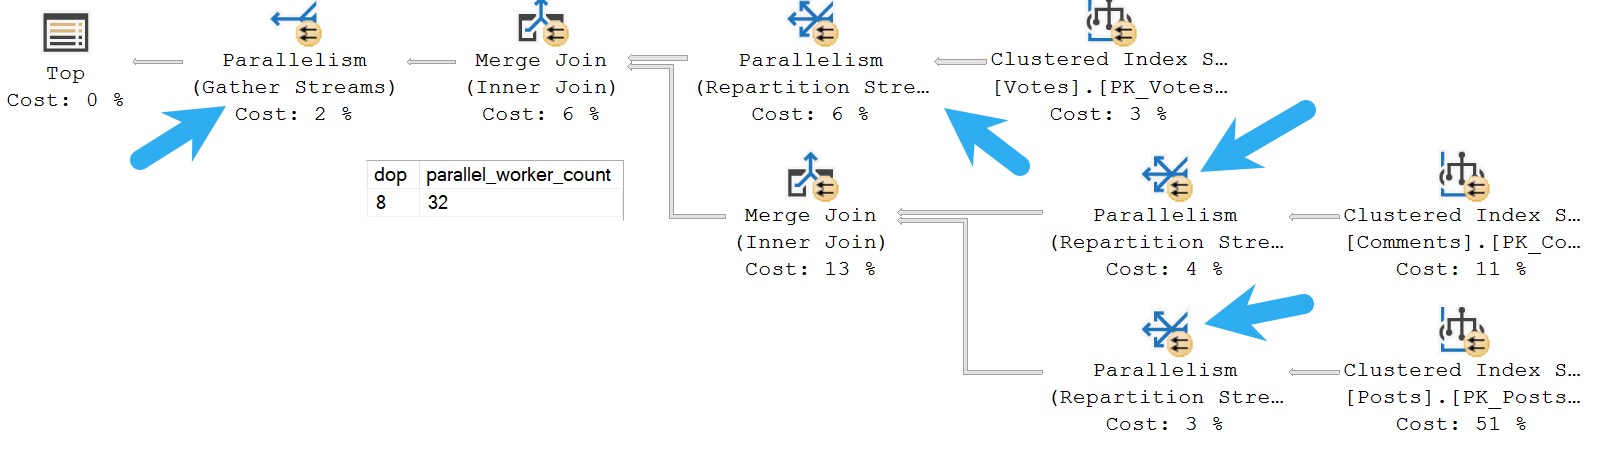
In this query plan, there are four parallel exchanges, which means four branches, so we get four x dop 8 parallel worker threads, totaling 32. Only 8 can be active concurrently, but all 32 are reserved by the query until it completes
On really overworked servers, SQL Server will downgrade DOP to preserve worker threads. Screenshots don’t really do that justice, but I demo it at the main page for sp_PressureDetector in the video.
Thanks for reading!
Going Further
If this is the kind of SQL Server stuff you love learning about, you’ll love my training. I’m offering a 75% discount to my blog readers if you click from here. I’m also available for consulting if you just don’t have time for that, and need to solve database performance problems quickly. You can also get a quick, low cost health check with no phone time required.
Related Posts
- SQL Server Community Tools: The Wrap Up And Combined Link
- SQL Server Community Tools: Why Does sp_PressureDetector Make A Big Deal About The Remote DAC?
- SQL Server Community Tools: sp_PressureDetector Doesn’t Show You Irrelevant Waits
- SQL Server Community Tools: Detecting Memory Pressure In SQL Server With sp_PressureDetector
What’s the correct way to determine the numer of system sessions? In this proc, you count the number of sessions with a session_id lower than 50 (line 830 in version 2.50). We have a large AlwaysOn environment, if I count the number of sessions without a program_name it’s up to 400. Shouldn’t it be “where status ‘background’ “?
I’d probably look for host processes that aren’t blank to see system threads, but I don’t get into doing that much.