It is possible to see a scalability bottleneck in the form of high average wait time for the RESERVED_MEMORY_ALLOCATION_EXT wait if a highly concurrent workload is run on a server that consumes memory with batch mode operators. I believe that the severity of the bottleneck depends on unknown factors in the server’s initial memory state and the rate of memory actually used by queries to run batch mode operations. This blog post shares a reproduction of the issue along with a call to action.
The Test Query
Data prep for the test query is very simple. We throw the first ten million sequential integers into two single column BIGINT tables. Additionally, an empty CCI is created to add eligibility for batch mode as desired:
DROP TABLE IF EXISTS DUMMY_CCI;
CREATE TABLE DUMMY_CCI (
	ID INT,
	INDEX CCI CLUSTERED COLUMNSTORE
);

DROP TABLE IF EXISTS HASH_JOIN_SCALE_TEST_1;
CREATE TABLE HASH_JOIN_SCALE_TEST_1 (
	ID BIGINT NOT NULL
);

INSERT INTO HASH_JOIN_SCALE_TEST_1 WITH (TABLOCK)
SELECT TOP (10000000) ROW_NUMBER()
	OVER (ORDER BY (SELECT NULL))
FROM master..spt_values t1
CROSS JOIN master..spt_values t2
CROSS JOIN master..spt_values t3
OPTION (MAXDOP 1);

DROP TABLE IF EXISTS HASH_JOIN_SCALE_TEST_2;
CREATE TABLE HASH_JOIN_SCALE_TEST_2 (
ID BIGINT NOT NULL
);

INSERT INTO HASH_JOIN_SCALE_TEST_2 WITH (TABLOCK)
SELECT TOP (10000000) ROW_NUMBER()
	OVER (ORDER BY (SELECT NULL))
FROM master..spt_values t1
CROSS JOIN master..spt_values t2
CROSS JOIN master..spt_values t3
OPTION (MAXDOP 1);
The SELECT query that we’re going to test with joins them together and returns a count of distinct IDs:
SELECT COUNT(DISTINCT t1.ID)
FROM dbo.HASH_JOIN_SCALE_TEST_1 t1
LEFT OUTER JOIN dbo.HASH_JOIN_SCALE_TEST_2 t2
	ON t1.ID = t2.ID
OPTION (MAXDOP 1);
This is certainly an odd thing to do, but the point of this query is to create a simple test case that uses a bit of memory to create hash tables. Without any indexes on the table we’re very likely to get a hash join. In row mode the query takes about 17 seconds on the test server and uses 1257528 KB of memory.
As far as I can tell this query is a good fit for batch mode. The join is on BIGINT columns and everything except for the rowstore scans can execute in batch mode:
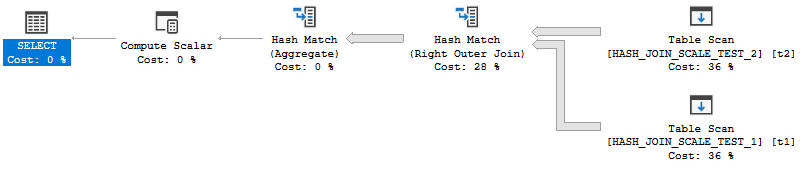
Even with the hidden conversions of 20 million rows from row mode to batch mode the query finishes in about 5 seconds. It uses significantly less memory compared to the row mode query: 386112 KB. All of this seems very reasonable.
Testing at Scale
The situation becomes less reasonable once there are many concurrent queries running at once. We go from the batch mode query running in a third of the time of row mode to sometimes running slower. Testing was done with 96 concurrent queries each running queries until 576 total queries were completed. Below is a graph of OS CPU and OS privileged time CPU based on perfmon data:
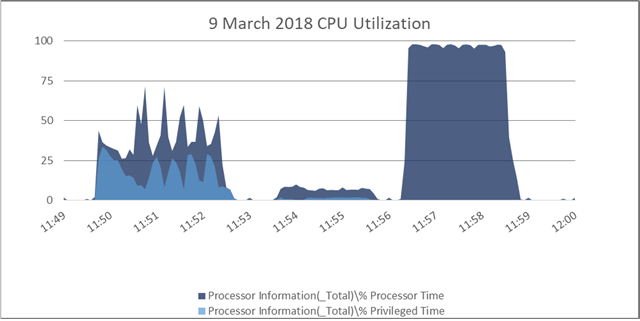
The first third of the graph corresponds to the batch mode workload. CPU never hits 100% and is extremely variable during the run. We also see a high amount of privileged time in the OS. Within SQL Server, we use a total of 222,400,512 KB of query memory. The total wait time for RESERVED_MEMORY_ALLOCATION_EXT can vary, but for this one it was around 11.5 million ms.
The second third of the graph is the part that resets the server memory state. As stated in the introduction, this scalability bottleneck doesn’t always happen and seems to have some kind of dependency on the server’s initial memory state. Here we do a SELECT COUNT(*) on a 1 TB table to add pressure to the rowstore buffer pool.
The final third of the graph corresponds to the row mode workload. CPU jumps to near 100% very quickly and doesn’t waver much during the run. There is very little privileged time in the OS. Within SQL Server, we use a total of 724,336,128 KB of query memory. The wait time for RESERVED_MEMORY_ALLOCATION_EXT is always significantly reduced compared to batch mode. For this run it was around 107k ms.
In conclusion, we see about 1% of memory wait time with the row mode workload compared to the batch mode workload. Usually the row mode workload finishes a little faster than the batch mode one, despite needing over 3X as much total memory and the per-query efficiency advantage of batch mode.
Speculation on the Problem
There may be a hint in the memory management architecture guide:
Starting with SQL Server 2012, SQL Server might allocate more memory than the value specified in the max server memory setting. This behavior may occur when the Total Server Memory (KB) value has already reached the Target Server Memory (KB) setting (as specified by max server memory). If there is insufficient contiguous free memory to meet the demand of multi-page memory requests (more than 8 KB) because of memory fragmentation, SQL Server can perform over-commitment instead of rejecting the memory request.
…
This behavior is typically observed during the following operations: Large Columnstore index queries.
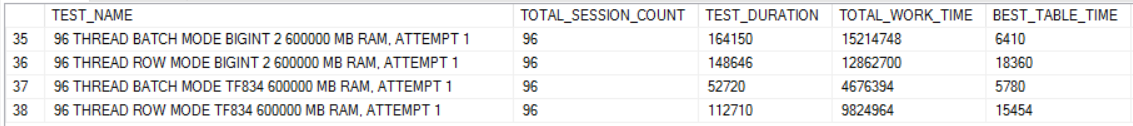
There are observable differences in how memory is allocated for the same operator when switching from batch mode to row mode. The number of wait events for RESERVED_MEMORY_ALLOCATION_EXT is significantly higher for row mode compared to batch mode. In addition, it remains nearly constant when TF 834 is enabled:

TF 834 appears to fully resolve the scalability issue with batch mode, just like last time. It offers a dramatic improvement in workload completion time:
Perhaps some batch mode operators require contiguous free memory for their allocations but the same operation done through row mode does not have that restriction. I can’t go any further than this because I don’t know anything about OS internals or memory management, but it could explain why we see such different behavior between row mode and batch mode.
Use Your Voice
Since SQL Server 2012, Microsoft has listed TF 834 as incompatible with columnstore. There are lots of scary consequences:
- A non-yielding scheduler error and associated memory dumps in the SQL Server Error log.
- Columnstore queries trigger severe performance issues.
- A SQL Server instance triggers access violations when you execute Columnstore queries.
- You encounter the following error when you run sp_createstats
However, I’ve been told that many of the SQL Server columnstore benchmarks for the TPC-H benchmarks use TF 834. It seems to be a natural fit for columnstore, and there are some workloads (seen in the lab and reproduced in the last two blog posts) where it resolves a key scalability bottleneck which is difficult to address through other means. I have created a feedback item on UserVoice requesting that Microsoft support TF 834 with columnstore.
Final Thoughts
Please provide feedback on the UserVoice item if you are able to do so. Thanks for reading!