Willfully
While I do enjoy answering questions about SQL Server performance, it can be frustrating trying to get the right set of information.
One thing that comes up pretty often when you ask for an actual execution plan, is that the query “never finishes” and one can’t be captured.
Good news! There are ways for you to get execution plans in progress with some of the actual query plan elements inside.
You don’t have to let the query run to completion, but generally if you give it a few minutes you can capture where things are going wrong.
Longer is usually better, but I understand that some queries are real crushers, and cause big server problems.
Option None: Live Query Plans
The problem with Live Query Plans is that they’re really unreliable. Many times I’ve tried to use them and the Live Plan never shows up, and worse I’ll be unable to close the SSMS tab without killing the process in Task Manager.
When it does work, it can be sort of confusing. Here’s a completed query with Live Plans enabled:
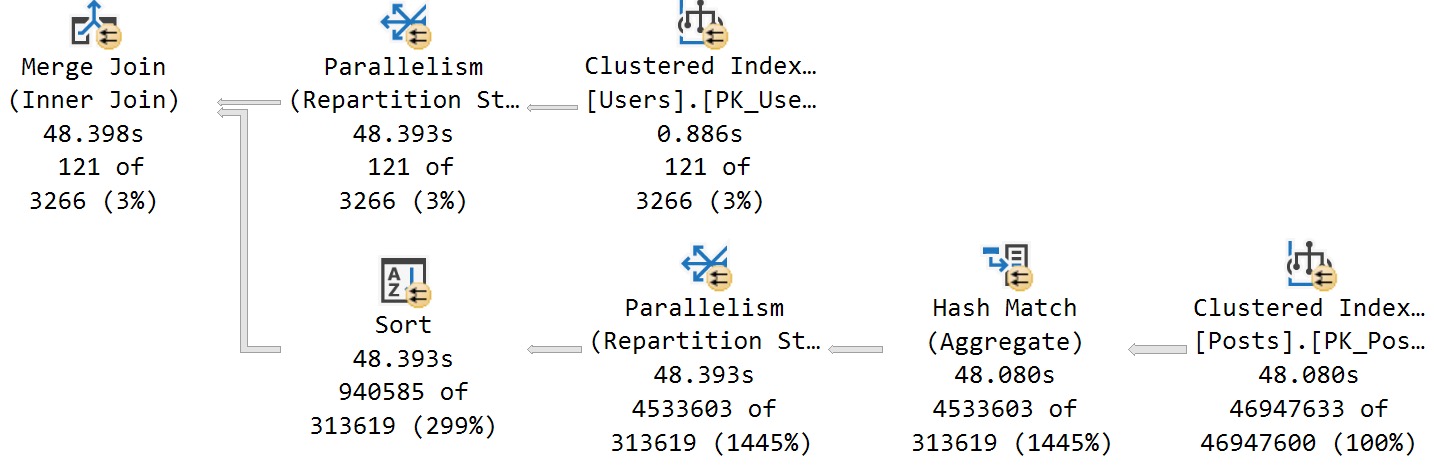
It took about 49 seconds, but… What took 49 seconds? Repartition Streams? Clustered Index Scan? Something else?
Here’s another really confusing one:
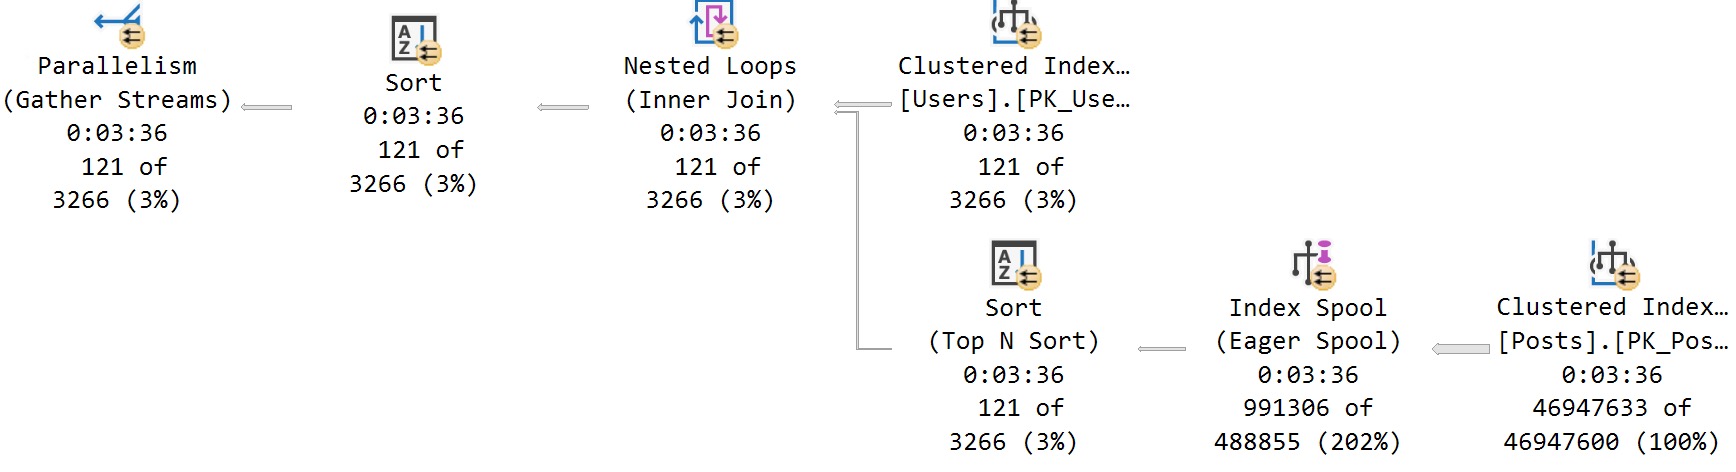
Apparently everything took three minutes and thirty six seconds.
Good to know.
Screw these things.
Option One: Get Plans + sp_WhoIsActive
Good ol’ sp_WhoIsActive will check to see if you have the right bits and views in your SQL Server, and return in-progress actual plans to you.
To do that, it looks at dm_exec_query_statistics_xml. That’s SQL Server 2016 and up, for those of you playing along at home. Hopefully you have it installed at home, because you sure don’t at work.
But anyway, if you enable either Actual Execution plans, OR Live Query Plans, and then run sp_WhoIsActive in another window, you’ll get much more sensible plans back. Usually.
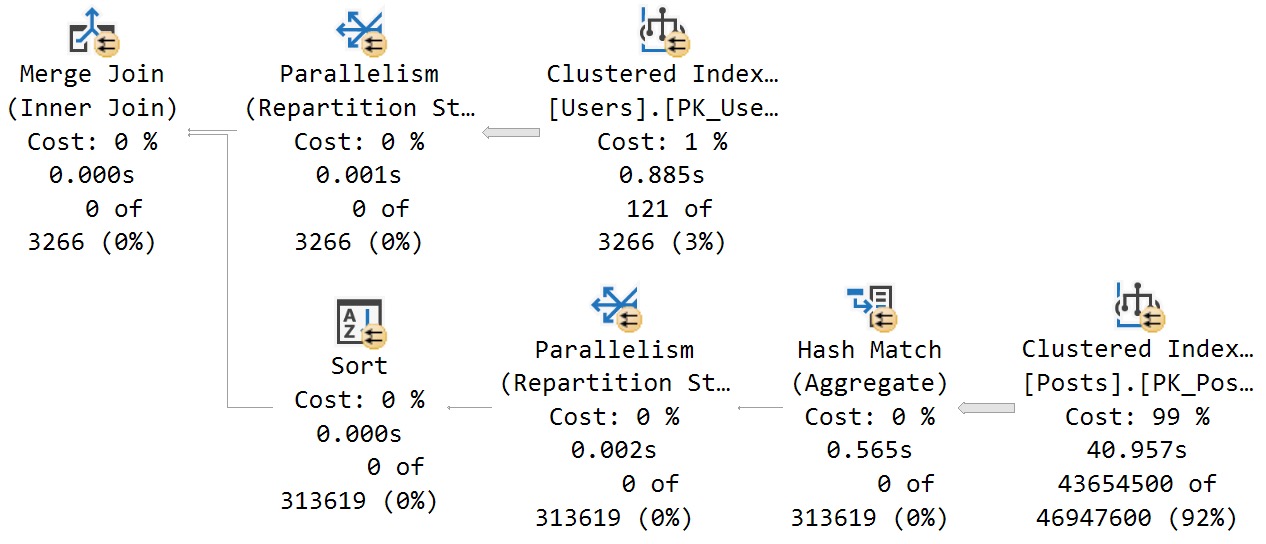
This accurately shows where time is spent in the query, which is largely in the scan of the Posts table.
Where There’s Still A Prioblem
Where things fall apart is still when a spool is built. If you can follow along a bit…
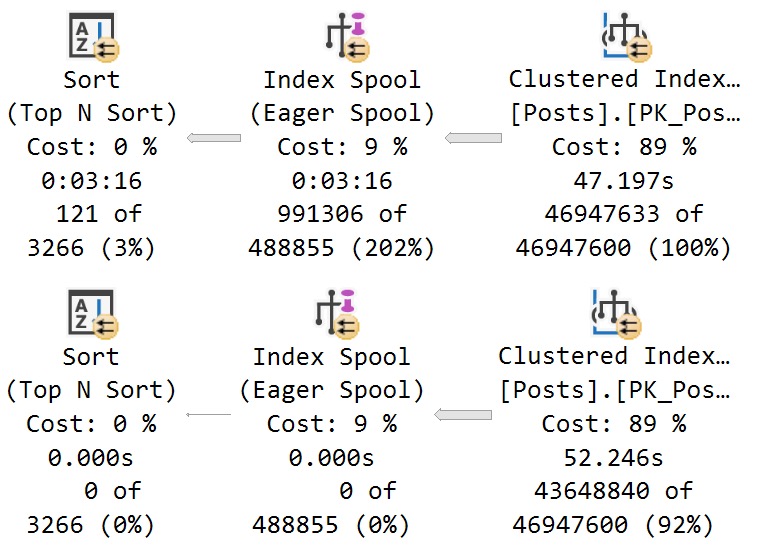
- The top query plan shows time accurately distributed amongst operators, from the Actual Plan run to completion
- The bottom query plan shows time quite inaccurately, getting the plan from dm_exec_query_statistics_xml after the query had been running for three minutes
I guess the bottom line is if you see an Eager Index Spool in your query plan, you should fix that before asking any questions.
Thanks for reading!
Going Further
If this is the kind of SQL Server stuff you love learning about, you’ll love my training. I’m offering a 75% discount to my blog readers if you click from here. I’m also available for consulting if you just don’t have time for that, and need to solve database performance problems quickly. You can also get a quick, low cost health check with no phone time required.
One thought on “What To Do When Your Query Runs For Too Long To Get An Actual Execution Plan”
Comments are closed.